Generic selectors
Exact matches only
Search in title
Search in content
Post Type Selectors

Popular stocks

Crypto

CFD

Currencies

Support

Gold

NZD/USD – Technical Analysis – 4h

March 6, 2026 13:00

Quick Summary

The chart analysis indicates is displaying a primarily bearish trend. With lower highs and lower lows, there is a continued downward momentum observed.

The analysis of technical indicators like MACD and volume suggests maintaining a cautious outlook.

Candlestick Analysis

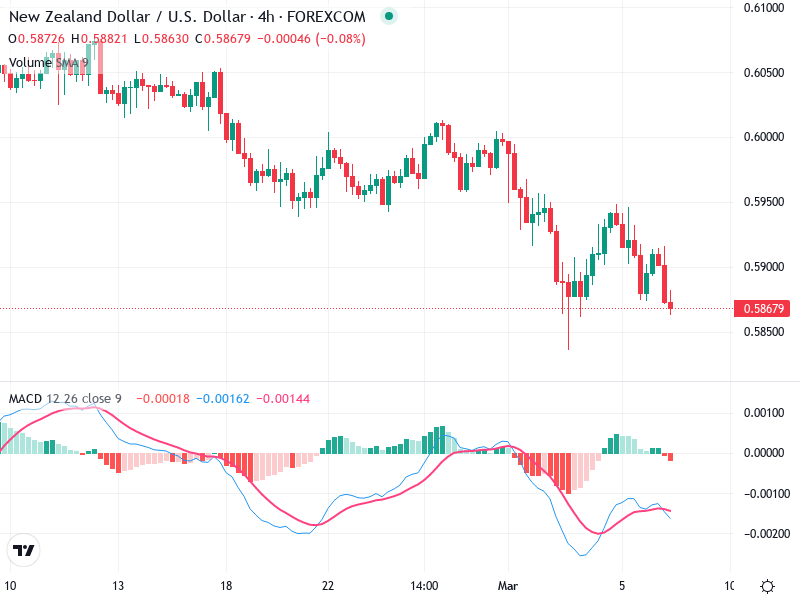
The chart shows a primarily bearish trend with lower highs and lower lows, indicating a continued downward momentum.

There is no prominent bullish reversal candlestick pattern visible recently. However, there are some instances of small bullish candles that failed to maintain momentum.

A potential pullback zone can be observed around the 0.5900 level, acting as a temporary resistance before continuation downward.

MACD Analysis

The MACD line is below the Signal line, suggesting a bearish trend continuation.

The histogram is slightly negative, indicating weak bearish momentum.

There is no clear divergence between the MACD and price action; both are moving in line with the bearish trend.

Volume Analysis

The volume does not show any substantial spikes, indicating a lack of strong buying or selling interest, which often comes with a consolidation phase.

The low volume does not strongly support the recent price movements, suggesting caution is warranted for confirming breakouts or trends.

This low activity reinforces the need for traders to wait for stronger signals before taking action.

Support & Resistance

Key support is near the 0.5850 level, where the price recently stalled, indicating buyers may be stepping in at this level.

Resistance is seen at the 0.5900 level, corroborated by previous price rejections around this area.

These levels suggest areas where prices may reverse or break through.

Actionable Insights

Consider entering long positions if a bullish reversal pattern emerges around the 0.5850 support with increased volume for confirmation.

Short positions can be contemplated if the price breaks below 0.5850 with strong bearish momentum and volume increase, targeting further downside.

Currently, a hold strategy is advisable until a clear break or reversal pattern is confirmed.

The AI Technical Analysis Center is an informational tool only and does not constitute investment or trading advice.
This site is registered on wpml.org as a development site. Switch to a production site key to remove this banner.