Generic selectors
Exact matches only
Search in title
Search in content
Post Type Selectors

Popular stocks

Crypto

CFD

Currencies

Support

Gold

NZD/USD – Technical Analysis – 4h

March 9, 2026 13:00

Quick Summary

The asset shows a bearish trend with potential reversal signs.

Key levels to watch are the support at 0.58500 and resistance at 0.59500.

The technical indicators suggest cautious market sentiment.

Candlestick Analysis

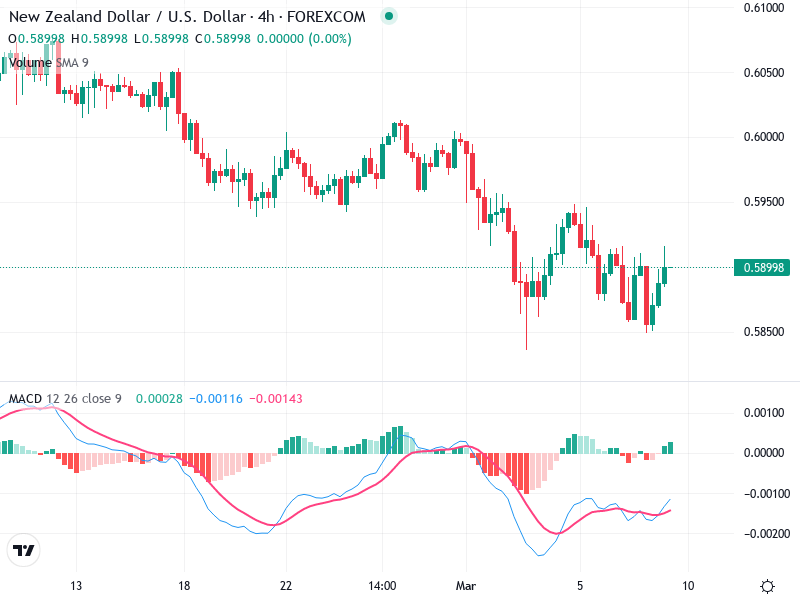
Recently, there is a potential hammer candlestick near the recent low, indicating a possible reversal from the downtrend. However, confirmation is needed.

No strong bullish engulfing or doji patterns observed currently.

Short-term, there appears to be a consolidation phase at the current level.

MACD Analysis

The MACD line is approaching the signal line from below, suggesting a potential bullish crossover.

This indicates a possible shift in momentum, but confirmation is required.

The histogram is currently increasing towards zero, suggesting weakening bearish momentum.

Volume Analysis

Volume is relatively low and stable, lacking a strong trend confirmation signal.

There are no unusual volume spikes, which might suggest a lack of institutional activity or indecision in the market.

Current volume does not strongly support any sudden price movement.

Support & Resistance

Key support at 0.58500, recent price action has held above this level.

Immediate resistance is around the 0.59500 level.

Strong resistance near 0.59500, aligning with prior peak levels.

Actionable Insights

Consider buying if a bullish MACD crossover occurs and price breaks above 0.59500 with volume support.

If price fails to hold above 0.58500 and MACD turns downwards, consider selling.

Current neutral conditions suggest holding until clearer signals appear.

The AI Technical Analysis Center is an informational tool only and does not constitute investment or trading advice.
This site is registered on wpml.org as a development site. Switch to a production site key to remove this banner.