Generic selectors
Exact matches only
Search in title
Search in content
Post Type Selectors

Popular stocks

Crypto

CFD

Currencies

Support

Gold

NZD/USD – Technical Analysis – 4h

March 12, 2026 13:00

Quick Summary

This chart analysis provides a detailed look at the asset’s recent price movements. The analysis is particularly focused on identifying key patterns and trends through various technical indicators.

The asset’s current technical environment is characterized by consistent resistance and potential signs of reversals, which are essential for making informed trading decisions.

Candlestick Analysis

The chart shows a recent bearish trend with some periods of sideways movement.

There are a few bullish candlesticks indicating potential rebounds, though these seem to be short-lived within a broader downtrend.

Any identifiable patterns, such as a bullish engulfing or hammer, appear to be followed by resistance around the 0.59500 area.

MACD Analysis

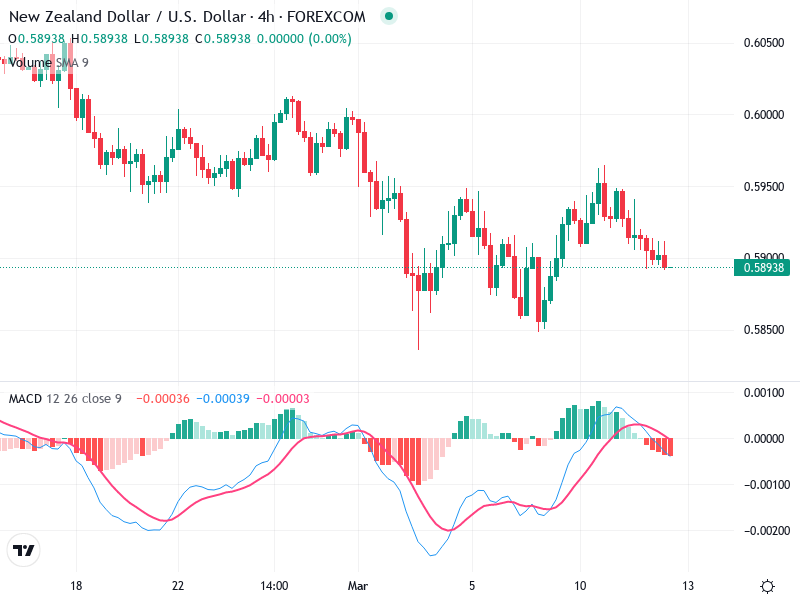
The MACD line is below the Signal line, indicating bearish momentum.

The histogram is in negative territory, which reinforces the bearish sentiment. The momentum appears to be weakening slightly as the histogram bars are becoming shorter.

There are no apparent divergences between the MACD and the price action, suggesting that the indicator is in line with the price movement.

Volume Analysis

There are no significant spikes in volume, suggesting the absence of strong buying or selling interest.

The lack of volume increase during price attempts to break resistance supports the continued bearish sentiment.

None observed, indicating limited institutional activity at this stage.

Support & Resistance

The area around 0.58500 appears to be a support level where the price has found buying interest.

The recent peaks near 0.59500 act as a resistance zone, where the price seems unable to break through.

These levels are crucial for identifying future breakouts or reversals.

Actionable Insights

Given the bearish trend, consider selling or holding short positions unless there is a confirmed breakout above 0.59500 with increased volume.

Monitor for a bullish MACD crossover or a strong candlestick reversal pattern near support levels for potential buying opportunities.

Watch for any unexpected volume spikes or macroeconomic news that could influence this currency pair.

The AI Technical Analysis Center is an informational tool only and does not constitute investment or trading advice.
This site is registered on wpml.org as a development site. Switch to a production site key to remove this banner.