Generic selectors
Exact matches only
Search in title
Search in content
Post Type Selectors

Popular stocks

Crypto

CFD

Currencies

Support

Gold

NZD/USD – Technical Analysis – 4h

August 25, 2025 07:04

Quick Summary

The 4-hour chart indicates potential shifts with bullish patterns emerging. Recent bullish engulfing patterns suggest a reversal in momentum. Continuous analysis is recommended to spot any future changes.

Candlestick Analysis

The chart shows a bullish engulfing pattern around the last major low, indicating potential reversal from bearish to bullish momentum.

This is followed by a series of green candlesticks indicating short-term bullish sentiment.

The price breaking above the recent consolidation zone around 0.584 is notable, suggesting a potential upward move.

MACD Analysis

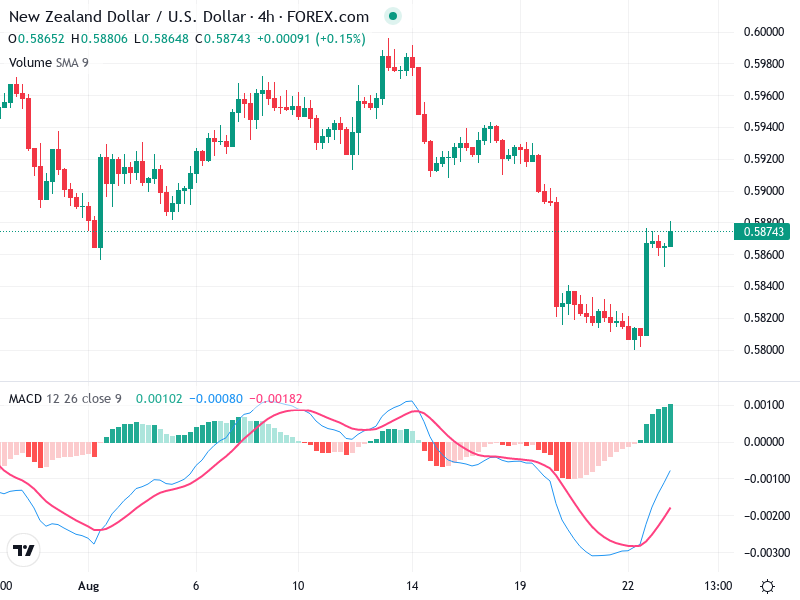
The MACD line has crossed above the Signal line, forming a bullish crossover, indicating a shift in momentum towards the upside.

The histogram has transitioned from negative to positive, reinforcing the bullish momentum.

No apparent divergences between MACD and price action are noted, supporting current price movements.

Volume Analysis

There is an increase in volume during the breakout move, supporting the strength of the bullish reaction.

The increased volume during the upward price movement suggests strong participation and validates the bullish sentiment.

The volume spike during the bullish engulfing pattern may indicate institutional activity supporting the price rise.

Support & Resistance

Key support is around 0.582, which was the recent low before the bullish reversal.

The next resistance is at approximately 0.590, a level that could challenge the bullish run if reached.

Actionable Insights

Consider buying on any pullback that maintains above the 0.582 support, especially if accompanied by bullish candlestick confirmations.

Watch for signs of reversal around the 0.590 resistance for potential short opportunities if confirmed by bearish patterns.

If already holding long positions, monitor the 0.590 resistance and adjust stop-losses accordingly.

The AI Technical Analysis Center is an informational tool only and does not constitute investment or trading advice.
This site is registered on wpml.org as a development site. Switch to a production site key to remove this banner.