Generic selectors
Exact matches only
Search in title
Search in content
Post Type Selectors

Popular stocks

Crypto

CFD

Currencies

Support

Gold

NZD/USD – Technical Analysis – 4h

September 24, 2025 12:00

Quick Summary

The chart exhibits a prevailing bearish trend, highlighted by successive lower highs and lower lows since mid-September. This suggests continued downward pressure on the asset.

Traders should remain cautious as the chart shows no significant bullish reversal patterns that would indicate an imminent trend change.

Candlestick Analysis

The chart shows a series of red candlesticks indicating a bearish trend. There is a noticeable absence of strong reversal patterns like a bullish engulfing or hammer, which suggests continued bearish momentum.

The trend is bearish, as indicated by the successive lower highs and lower lows from mid-September onward.

There was a notable pullback around the 20th, followed by a continuation of the downtrend.

MACD Analysis

The MACD line is below the Signal line, indicating bearish momentum.

The histogram shows decreasing negative momentum, which might suggest a slowing of the bearish pressure but is not yet indicative of a reversal.

There does not appear to be any significant divergence between the MACD and the price action, which confirms the continuation of the current trend.

Volume Analysis

Volume appears to have increased during the recent declines, supporting the validity of the bearish trend.

The rise in volume during downtrends suggests strong participation in the selling activity, possibly indicating institutional involvement.

No significant volume spikes were observed that would indicate anomaly transactions.

Support & Resistance

The area around 0.5820 may act as a support level, as the price has neared it but not closed below it decisively.

The region around 0.5960 is a recent high and could serve as resistance if the trend were to attempt a reversal.

Actionable Insights

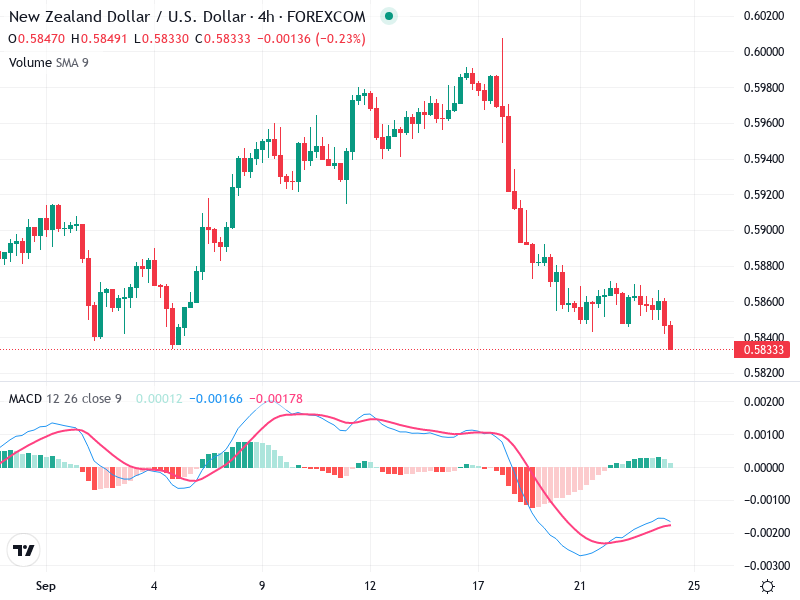
Given the current bearish trend, short positions may be favorable until there is a clear sign of reversal.

Monitor for any bullish candlestick patterns or a MACD crossover that might suggest a reversal. Also, keep an eye on volume anomalies at key levels for potential trend changes.

Be cautious of any sudden bullish reversal patterns, especially near the 0.5820 support level, which could invalidate the bearish setup.

The AI Technical Analysis Center is an informational tool only and does not constitute investment or trading advice.
This site is registered on wpml.org as a development site. Switch to a production site key to remove this banner.