Generic selectors
Exact matches only
Search in title
Search in content
Post Type Selectors

Popular stocks

Crypto

CFD

Currencies

Support

Gold

NZD/USD – Technical Analysis – 4h

October 1, 2025 12:00

Quick Summary

The asset chart reveals interesting patterns and potential movements in the market.

It’s essential to watch for upcoming trends that might influence trading strategies.

Understanding these indicators can provide actionable insights.

Candlestick Analysis

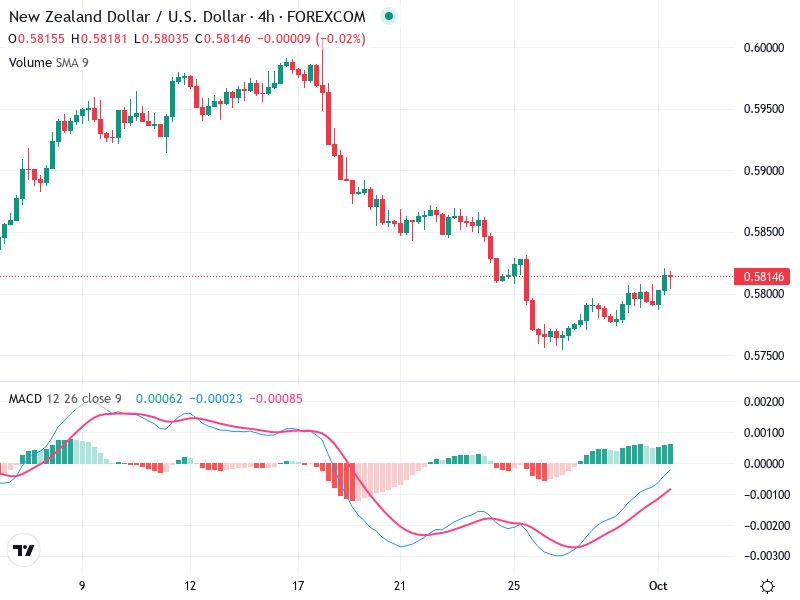
The chart displays a predominantly bearish trend, as indicated by a series of descending candlesticks leading up to the current point.

A recent small bullish recovery is visible, marked by several green candlesticks forming a potential reversal pattern, such as a bullish engulfing, which suggests a short-term bullish correction.

Current levels around 0.58000 might be a critical pullback zone. If the price holds above this, it might support a continuation of the bullish correction.

MACD Analysis

The MACD line is crossing above the signal line, indicating a bullish crossover, usually a bullish signal.

The histogram has transitioned from negative to positive territory, signifying increasing bullish momentum.

No significant divergence observed between MACD and price action at this point.

Volume Analysis

Volume appears consistent without major spikes, suggesting the move is not strongly supported by volume yet.

No unusual spikes in volume that would indicate significant institutional involvement.

Consistent volume suggests a steady interest in the market trend.

Support & Resistance

Around 0.57500 appears to be a strong support level based on historical price data.

Immediate resistance sits around 0.58500, where price has paused previously.

These levels are crucial for traders to watch for potential entry and exit points.

Actionable Insights

Consider buying if the price breaks and holds above the 0.58500 resistance, supported by an increase in volume.

Watch for potential sell signals if the price fails to sustain above 0.58000, especially if accompanied by a bearish MACD crossover.

Hold current positions until the price conclusively breaks above resistance or falls below support.

The AI Technical Analysis Center is an informational tool only and does not constitute investment or trading advice.
This site is registered on wpml.org as a development site. Switch to a production site key to remove this banner.