Generic selectors
Exact matches only
Search in title
Search in content
Post Type Selectors

Popular stocks

Crypto

CFD

Currencies

Support

Gold

NZD/USD – Technical Analysis – 4h

October 2, 2025 12:00

Quick Summary

The chart for the asset shows a recent technical change with an indication of a potential bullish trend. Observing the price movements reveals patterns that forecast a further upward momentum. Vigilance is advised as the price nears key resistance levels.

Candlestick Analysis

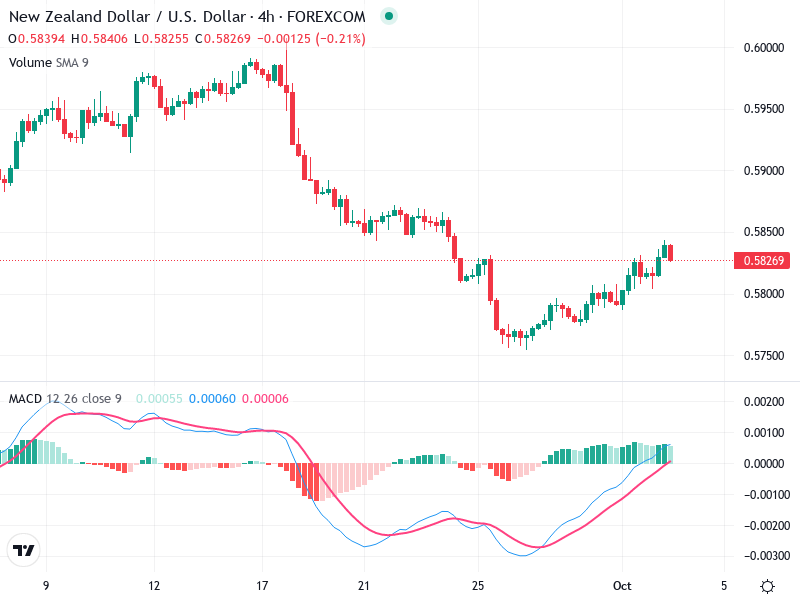
The chart shows a recent bullish reversal after a sustained bearish trend. Noticeable after the significant downward movement, the price starts forming higher lows and higher highs, indicating a potential uptrend.

Around September 25th, a potential hammer-like pattern appears, signaling a possible reversal from the bearish movement. This is followed by a series of bullish candles.

The area around 0.5800 acts as a potential breakout zone which the price has recently tested and is now moving upwards, suggesting bullish momentum.

MACD Analysis

The MACD line is above the Signal line, which is indicative of a bullish crossover. This crossover supports the recent upward price movement.

The histogram shows increasing green bars, suggesting strengthening bullish momentum.

There is no clear divergence currently observed between the MACD and the price action, reinforcing the bullish sentiment.

Volume Analysis

There is a moderate increase in volume during the recent bullish movement, which supports the upward price action.

No distinctly unusual spikes in volume are observed, suggesting the movement is not yet driven by significant institutional activity.

Support & Resistance

The 0.5750 area previously acted as a strong support where the price saw a reversal.

The price is approaching a resistance level around 0.5850, which, if broken, could lead to further upward movement.

Actionable Insights

Consider entering a long position if the price breaks above the 0.5850 resistance with strong volume, confirming the bullish breakout.

Look for bearish reversal signals or a bearish MACD crossover to consider a short position.

If positioned long, maintain vigilance around the 0.5850 resistance level and watch for signs of reversal.

The AI Technical Analysis Center is an informational tool only and does not constitute investment or trading advice.
This site is registered on wpml.org as a development site. Switch to a production site key to remove this banner.