Generic selectors
Exact matches only
Search in title
Search in content
Post Type Selectors

Popular stocks

Crypto

CFD

Currencies

Support

Gold

NZD/USD – Technical Analysis – 4h

October 13, 2025 12:01

Quick Summary

The NZD/USD 4-hour chart illustrates a strong bearish trend with persistent lower highs and lower lows.

However, price stabilization around 0.57200 suggests potential base formation.

Key attention is on the breach of support or resistance levels for a clear directional signal.

Candlestick Analysis

The chart shows several bearish candlesticks dominating the recent trend, indicating selling pressure.

There are occasional bullish candles, but no major reversal patterns like the bullish engulfing or hammer are visible.

The overall trend is bearish, as evidenced by the succession of lower highs and lower lows.

MACD Analysis

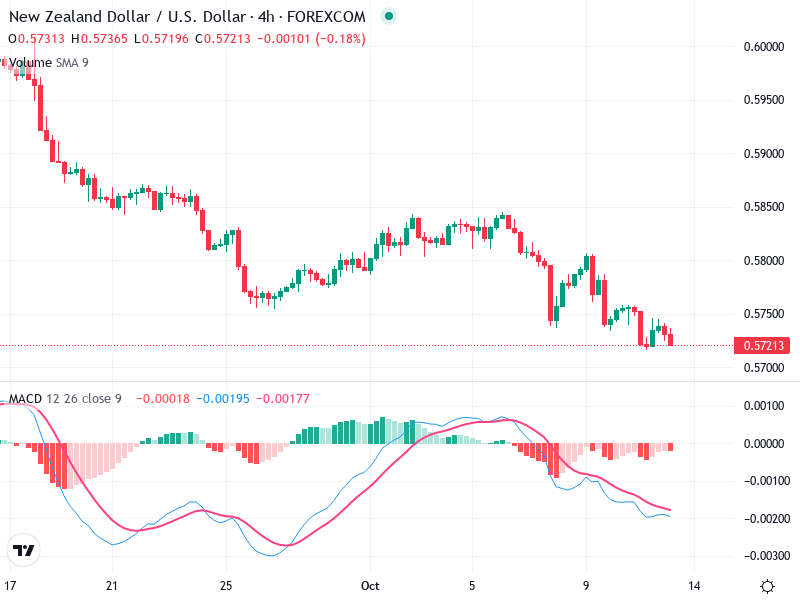
The MACD line is below the signal line, indicating a bearish crossover, which suggests continued downward momentum.

The histogram shows negative values, reinforcing the bearish sentiment, although contraction may suggest bearish momentum is decreasing slightly.

No significant divergence between price action and MACD is observed, supporting the current bearish trend.

Volume Analysis

Volume has been consistent, with a slight decrease as prices consolidate around 0.57200.

This decrease might suggest waning seller enthusiasm.

The low volume on price stabilization could imply a lack of conviction from both bulls and bears.

Support & Resistance

The key support level is at 0.57000, where a breach could lead to further selling pressure.

Immediate resistance is noted around 0.58000, and a break above this could challenge the bearish trend.

Keep an eye on these critical levels for clearer trend indications.

Actionable Insights

Consider buying if the price consolidates and shows bullish reversal patterns above 0.57200 with increased volume.

Selling is advisable if prices break and sustain below the 0.57000 support level with a spike in bearish volume.

Holding might be prudent until a clearer trend direction is established given the current sideways movement and volume decrease.

The AI Technical Analysis Center is an informational tool only and does not constitute investment or trading advice.
This site is registered on wpml.org as a development site. Switch to a production site key to remove this banner.