Generic selectors
Exact matches only
Search in title
Search in content
Post Type Selectors

Popular stocks

Crypto

CFD

Currencies

Support

Gold

NZD/USD – Technical Analysis – 4h

October 15, 2025 12:01

Quick Summary

The NZD/USD 4-hour chart reveals insightful technical patterns. There is evidence of recent bullish momentum, potentially hinting at a change in trend. However, broader market conditions maintain a cautious outlook for sustained bullish momentum.

Candlestick Analysis

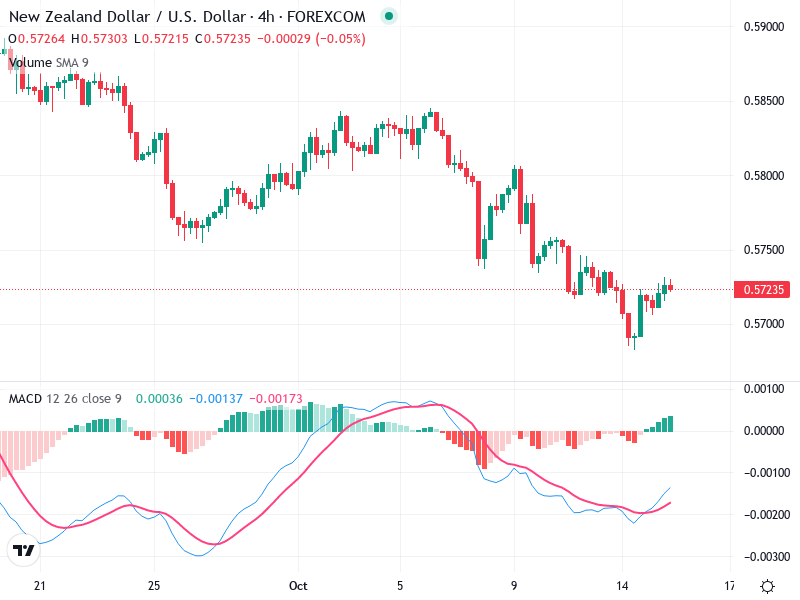
There appears to be a series of small-bodied candles indicating indecision, followed by a bullish engulfing pattern around October 11th, suggesting a potential reversal.

The trend has been predominantly bearish with lower highs and lower lows, but recent price action indicates a potential shift towards consolidation or slight bullishness.

The area around 0.5700 acts as a recent pullback zone after a short-term bullish reversal.

MACD Analysis

The MACD line has crossed above the Signal line, indicating a bullish crossover.

The histogram is moving from negative to positive territory, suggesting increasing bullish momentum.

There is no clear divergence between MACD and price action, but momentum is building on the bullish side.

Volume Analysis

There is modest volume during the recent bullish movement, supporting the price action.

The increased volume during the reversal suggests some confidence behind the move, though conviction could strengthen.

No significant unusual volume spikes indicating institutional activities.

Support & Resistance

Primary support is around 0.5700, evidenced by multiple retests.

Immediate resistance is near 0.5750, a recent peak.

Additional resistance can be observed around 0.5800 from previous highs.

Actionable Insights

If bullish momentum continues with increased volume, consider buying at breaks above 0.5750 towards 0.5800.

Look for bearish cues near resistance levels around 0.5750-0.5800 for potential short positions if the MACD crosses back down.

Holding is advisable until a clearer trend direction is established beyond current consolidation zones.

The AI Technical Analysis Center is an informational tool only and does not constitute investment or trading advice.
This site is registered on wpml.org as a development site. Switch to a production site key to remove this banner.