Generic selectors
Exact matches only
Search in title
Search in content
Post Type Selectors

Popular stocks

Crypto

CFD

Currencies

Support

Gold

NZD/USD – Technical Analysis – 4h

October 16, 2025 12:00

Quick Summary

The NZD/USD chart shows recent market indecision with potential bullish movement emerging.

The asset’s overall trend appears to be attempting a reversal.

Candlestick Analysis

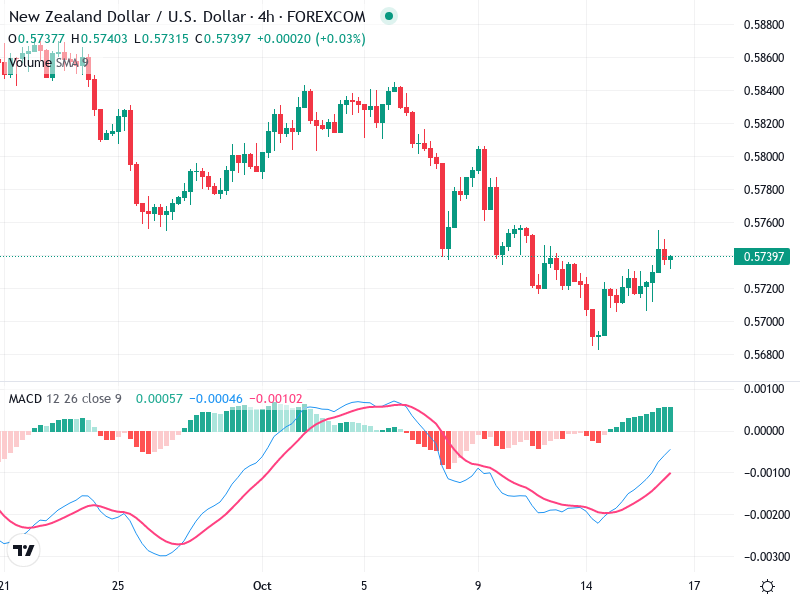
Recently, there's a series of small-bodied candles indicating indecision in the market, but this is followed by a few bullish candles suggesting a potential upward move.

No strong engulfing or hammer patterns are evident, but the presence of a few dojis signals caution among traders.

The overall trend in the visible period seems to be bearish, but there is a recent attempt to reverse with higher lows forming around October 10-14. Current action shows a potential for a minor bullish reversal.

MACD Analysis

A recent bullish crossover has occurred below the zero line, indicating a potential shift to bullish momentum.

The histogram just turned positive, suggesting increasing bullish momentum.

There are no clear bullish or bearish divergences present between the MACD and price at this time.

Volume Analysis

Volume appears to be declining slightly, which could indicate a lack of strong conviction in either direction.

Lack of volume supporting the potential bullish reversal could mean that any upward movements may be tentative unless volume picks up.

No significant spikes indicating institutional activity at present.

Support & Resistance

Strong support appears around the 0.5700 level.

Immediate resistance is located around 0.5750 and 0.5800. A break above these could lead to a stronger bullish trend.

The area around 0.5720 acted as a support recently, with a potential breakout evident if it moves decisively above 0.5750.

Actionable Insights

A hold or cautious buy approach is suggested if prices break and hold above 0.5750 with increased volume for bullish confirmation.

Consider selling if prices fall below the 0.5700 support with increased bearish volume.

Monitor for confirmation signals above 0.5750 with higher trading volume.

The AI Technical Analysis Center is an informational tool only and does not constitute investment or trading advice.
This site is registered on wpml.org as a development site. Switch to a production site key to remove this banner.