Generic selectors
Exact matches only
Search in title
Search in content
Post Type Selectors

Popular stocks

Crypto

CFD

Currencies

Support

Gold

NZD/USD – Technical Analysis – 4h

August 27, 2025 07:05

Quick Summary

The chart currently displays a bearish sentiment with significant patterns indicating potential downward movement.

Breakout zones and volume analysis suggest notable selling pressure around significant support levels.

Candlestick Analysis

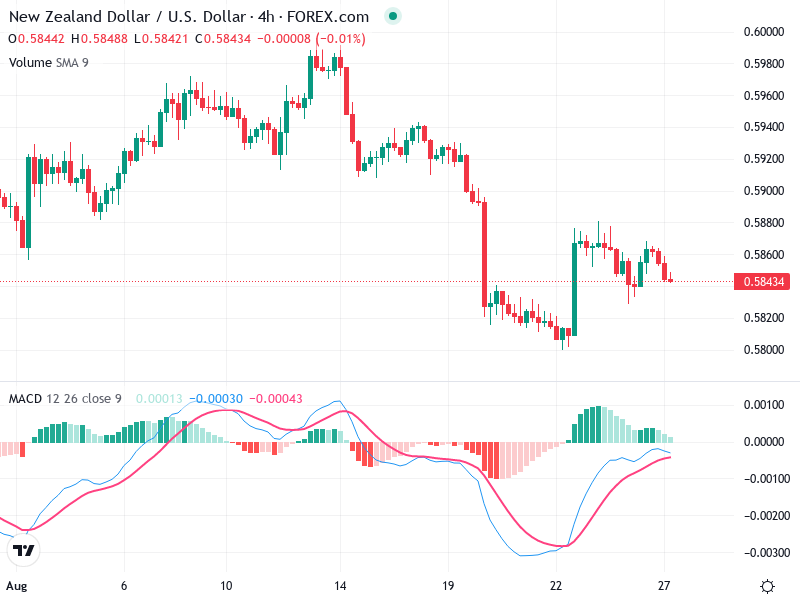
There is a notable bearish engulfing pattern on the 22nd, followed by a strong downward movement, indicating bearish sentiment.

The chart reflects a bearish trend beginning mid-August, with a sharp sell-off and a current pause, indicating potential consolidation or future decline.

The sharp decline around the 19th illustrates a breakout zone below 0.5860, which breached crucial support.

MACD Analysis

The MACD line is below the Signal line, signaling a bearish crossover with continued downward pressure.

The MACD histogram remains negative, though shrinking bars suggest weakening bearish momentum.

No clear divergences exist between MACD and price, both confirming the downward trend.

Volume Analysis

A significant volume spike during the sharp decline indicates strong selling pressure, possibly institutional.

Recent volume decrease compared with the sharp sell-off suggests market consolidation post-drop.

This volume trend supports the view of a market that is pausing in its current direction.

Support & Resistance

Support appears near 0.5820, providing some price stability.

Significant resistance is identified near 0.5860, where previous support was breached.

The breach of this resistance indicates potential for further bearish movement.

Actionable Insights

With the bearish sentiment, buying is not advised at this stage; traders might consider short positions with tight stop-loss above 0.5860.

Monitoring for a confirmed breakout below 0.5820 can indicate further downside, while a move above 0.5860 might signal a reversal.

Watch out for reversal risks if prices move significantly above current resistance levels.

The AI Technical Analysis Center is an informational tool only and does not constitute investment or trading advice.
This site is registered on wpml.org as a development site. Switch to a production site key to remove this banner.