Generic selectors
Exact matches only
Search in title
Search in content
Post Type Selectors

Popular stocks

Crypto

CFD

Currencies

Support

Gold

NZD/USD – Technical Analysis – 4h

October 29, 2025 13:01

Quick Summary

The chart presents a fascinating overview of the current market dynamics.

The price action is navigating through critical support and resistance levels, indicating potential shifts.

Close observation of key technical indicators is essential for future direction insights.

Candlestick Analysis

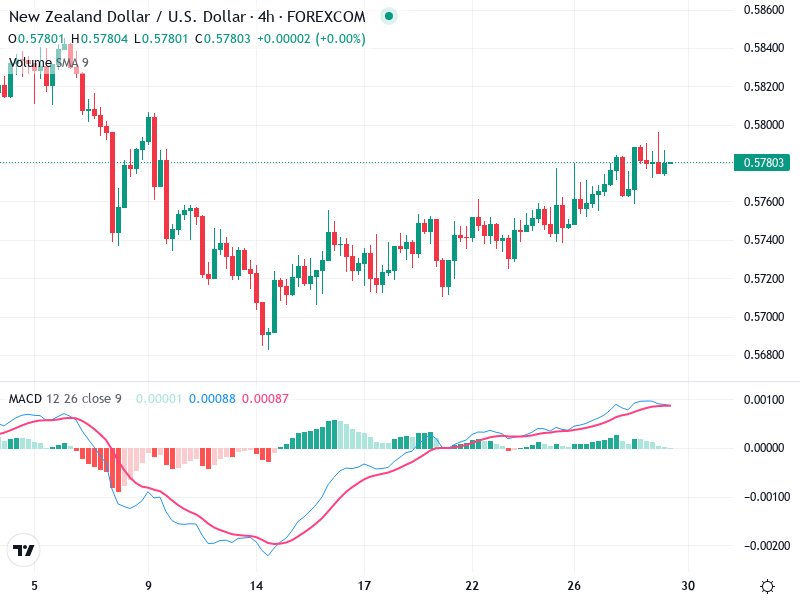
No clear bullish or bearish engulfing patterns are evident. However, the presence of small-bodied candles suggests indecision in the market.

There are instances of doji and spinning top candles, indicating potential reversals or pauses in the trend.

The trend appears to be gradually shifting from bearish to bullish. Initially, there was a downtrend, but a series of higher lows and higher highs suggest a transition to an upward trend.

MACD Analysis

The MACD line is above the Signal line, indicating a bullish crossover that suggests upward momentum.

The histogram shows positive bars, although they are decreasing in size, indicating a weakening bullish momentum.

No significant divergence between MACD and price action is observed at this time.

Volume Analysis

Volume has been relatively stable with no dramatic spikes. This suggests that current price movements are not strongly supported by volume, raising caution regarding the strength of trends.

The steady volume with recent upward price movements indicates a cautious, gradual buying interest rather than strong institutional action.

Support & Resistance

Support is approximately at 0.5720, where multiple candles have recently found a base.

Resistance is around 0.5800, a level where prices have recently stalled.

Breaching the resistance at 0.5800 with high volume could lead to further upside. Conversely, if prices fall below the support at 0.5720, it might signal a bearish downturn.

Actionable Insights

Consider a buy if there's a close and sustain above 0.5800 with a volume increase to confirm a true breakout.

Watch for a sell if the price closes below 0.5720, potentially signaling the resumption of the downtrend.

Hold positions if the price consolidates between 0.5720 and 0.5800, awaiting a decisive move.

The AI Technical Analysis Center is an informational tool only and does not constitute investment or trading advice.
This site is registered on wpml.org as a development site. Switch to a production site key to remove this banner.