Generic selectors
Exact matches only
Search in title
Search in content
Post Type Selectors

Popular stocks

Crypto

CFD

Currencies

Support

Gold

NZD/USD – Technical Analysis – 4h

October 31, 2025 13:00

Quick Summary

The chart shows a bearish trend, characterized by significant patterns indicating further downside potential. Asset price movements reveal important technical levels.

The analysis points toward maintaining awareness of key support and resistance levels for actionable insights.

Candlestick Analysis

The chart shows a series of bearish candlesticks indicating a recent downward trend.

No strong reversal patterns like a bullish engulfing or hammer are evident, suggesting continued bearish sentiment.

The trend appears bearish, with lower highs and lower lows forming.

MACD Analysis

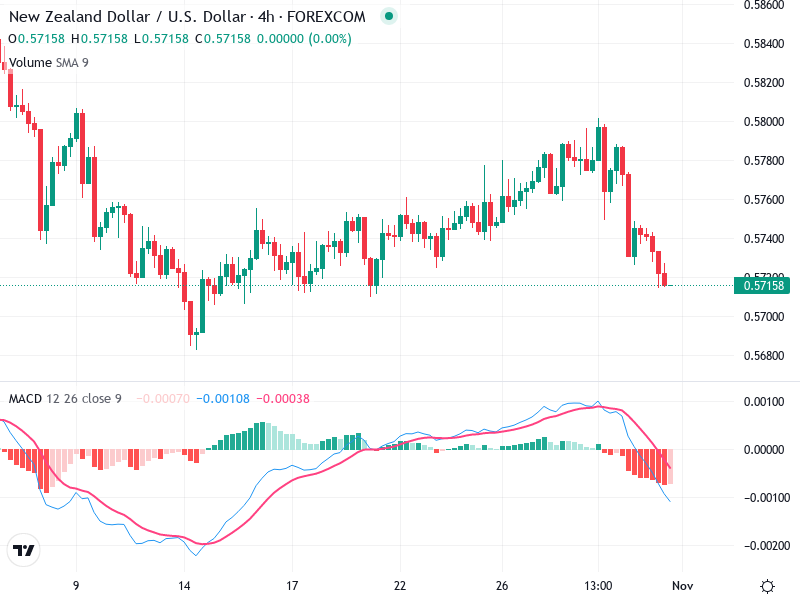
The MACD line is below the Signal line, indicating bearish momentum.

A bearish crossover has occurred earlier, and the histogram shows increasing negative bars.

There is no clear divergence currently visible between the MACD and price action, both indicating bearishness.

Volume Analysis

The volume appears relatively stable without significant spikes, meaning the current price movement is not strongly volume-supported.

The lack of high volume implies that there may not be strong conviction behind the downturn, which can lead to potential reversal or consolidation.

No unusual spikes to indicate institutional activity.

Support & Resistance

Key support is around the 0.5700 level; a break below might lead to further decline.

The resistance zone is around 0.5780 where price had attempted to breach multiple times.

These levels are crucial as they can signal potential reversal points if volume supports a reaction to these levels.

Actionable Insights

Short-term traders might contemplate short positions given the bearish trend, but should await further confirmation from volume or stronger bearish patterns.

Long-term holders should be cautious but can watch for reversal signals around the support zone.

Observe for any bullish reversal patterns near the support level with increased volume to confirm potential rebounds.

The AI Technical Analysis Center is an informational tool only and does not constitute investment or trading advice.
This site is registered on wpml.org as a development site. Switch to a production site key to remove this banner.