Generic selectors
Exact matches only
Search in title
Search in content
Post Type Selectors

Popular stocks

Crypto

CFD

Currencies

Support

Gold

NZD/USD – Technical Analysis – 4h

August 28, 2025 07:05

Quick Summary

This chart showcases the recent price movements of the NZD/USD pair. The pair displays a clear bearish trend with subsequent consolidation. Monitoring these levels can offer insights into potential directional shifts.

Candlestick Analysis

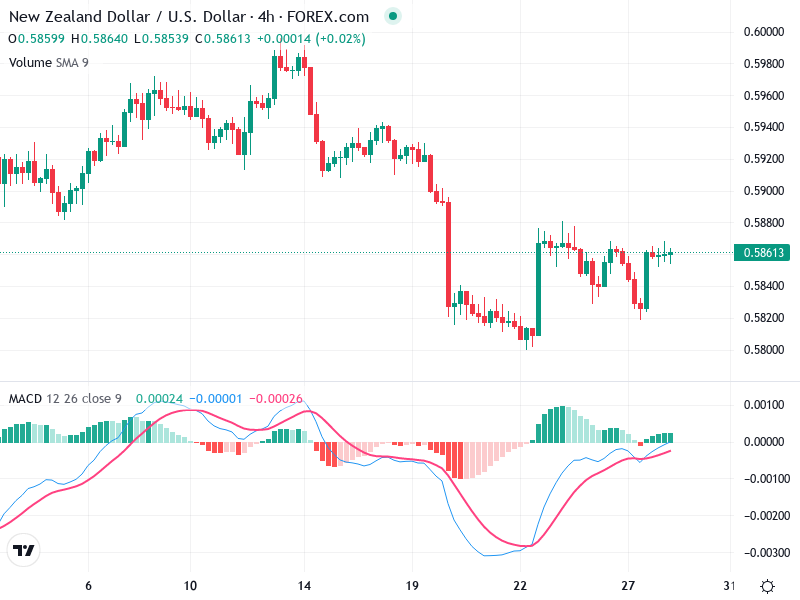
The NZD/USD pair exhibits a bearish trend from the start of the chart, characterized by lower highs and lower lows, followed by a period of consolidation.

There seems to be a small bullish engulfing pattern towards the end of the downtrend, indicating a possible reversal or a pause in the bearish momentum. Currently, the price exhibits sideways movement, indicating consolidation.

The recent range appears to be between 0.5840 and 0.5885. A breakout above or below this range could signify the next directional move.

MACD Analysis

The MACD line is beginning to cross above the Signal line, signaling a bullish crossover. This suggests a potential shift in momentum towards the upside.

The MACD histogram is slightly positive, indicating a developing bullish momentum. If the histogram continues to expand, it could further confirm an upward trend.

Currently, there is no visible divergence between the MACD and price action.

Volume Analysis

There is a decrease in volume compared to the sharp decline seen earlier in the chart. This supports the current consolidation phase.

The lower volume typically indicates indecision. An increase in volume alongside a price breakout will be critical for confirming any directional move.

The earlier significant volume spike correlates with the large bearish candlestick, which suggests previous strong selling pressure, possibly from institutional activity.

Support & Resistance

The area around 0.5885 serves as a short-term resistance zone.

The price level around 0.5840 acts as a current support level, with a more significant support area near 0.5810, based on prior lows.

Actionable Insights

Traders may consider a buy position if the price breaks above 0.5885, especially if supported by increasing volume. Conversely, a break below 0.5840 with adequate volume could trigger a short position.

Monitor for volume increase as a confirmation signal. Keep an eye on the MACD for maintaining its crossover signal.

Watch for potential false breakouts given the current low volume and consolidating price range.

The AI Technical Analysis Center is an informational tool only and does not constitute investment or trading advice.
This site is registered on wpml.org as a development site. Switch to a production site key to remove this banner.