Generic selectors
Exact matches only
Search in title
Search in content
Post Type Selectors

Popular stocks

Crypto

CFD

Currencies

Support

Gold

NZD/USD – Technical Analysis – 4h

August 29, 2025 07:04

Quick Summary

The NZD/USD 4-hour chart suggests potential bullish momentum after a significant rally characterized by bullish formations.

The consolidation and breakout patterns indicate a possible shift in trend direction.

Volume and MACD analyses further support this observation, signaling a potential uptrend.

Candlestick Analysis

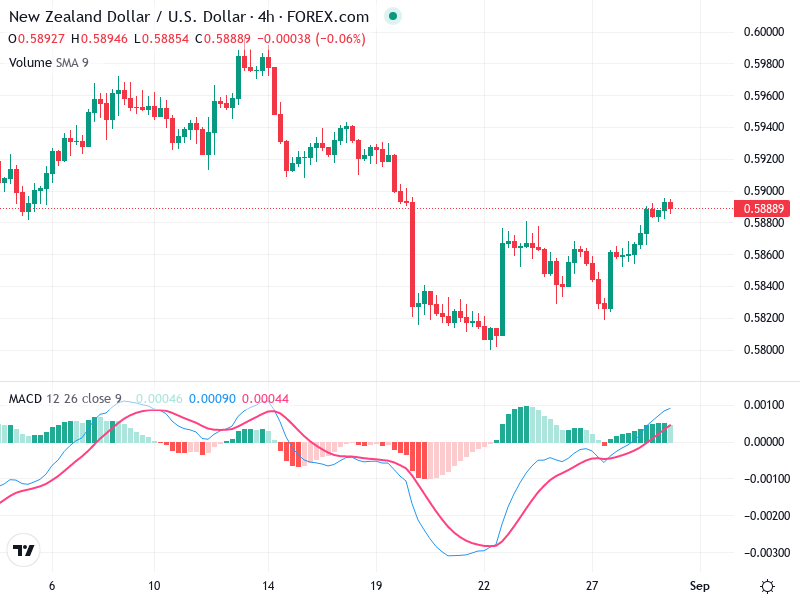
There is a noticeable rally with a series of bullish candles after the pronounced drop, forming a 'bullish engulfing' pattern around August 22, suggesting a potential reversal.

The trend is showing signs of shifting from bearish to sideways, with recent bullish momentum.

There is a breakout zone near 0.5860, where the price consolidated before moving upwards.

MACD Analysis

The MACD line has crossed above the Signal line, indicating a recent bullish crossover which suggests potential upward momentum.

The MACD histogram is trending upwards, reinforcing the bullish sentiment by showing increasing momentum.

There are no significant divergences at the moment, which aligns the MACD with the current price recovery.

Volume Analysis

Volume increased during the bullish engulfing pattern, reinforcing the strength of that reversal movement.

The increase in volume during price increases is supportive of the upward price movement, indicating strong buyer interest.

No unusual volume spikes hinting at hidden institutional activity are observed other than the alignment with bullish price action.

Support & Resistance

Key support is at the 0.5820 level, where consolidation occurred before the current move up.

Immediate resistance is around 0.5900, where the price is currently testing, and a further move above could invite more buyers.

A robust break of resistance zones is needed for confirmation of a trend reversal to bullish.

Actionable Insights

Consider buying if the price breaks and holds above the 0.5900 resistance with strong volume.

Look for potential shorting opportunities if the price fails to break 0.5900 convincingly and falls back below 0.5860.

Holding may be advisable if the price consolidates in the current range between 0.5860 and 0.5900 to wait for a clearer direction.

The AI Technical Analysis Center is an informational tool only and does not constitute investment or trading advice.
This site is registered on wpml.org as a development site. Switch to a production site key to remove this banner.