Generic selectors
Exact matches only
Search in title
Search in content
Post Type Selectors

Popular stocks

Crypto

CFD

Currencies

Support

Gold

NZD/USD – Technical Analysis – 4h

November 20, 2025 13:00

Quick Summary

The NZD/USD 4-hour chart signals a predominantly bearish trend. With consistent lower highs and lows, the current structure reflects caution. However, a potential reversal pattern is emerging.

Volume and key indicators suggest a continuation, but traders should remain vigilant for any bullish signals.

Candlestick Analysis

The overall trend is bearish, with consistent lower highs and lower lows observed in the chart.

There's a potential hammer candlestick observed near the current price level, indicating a possible attempt at reversal.

The recent price action suggests a potential breakout below the 0.56100 level could lead to further declines.

MACD Analysis

The MACD line is below the Signal line, suggesting a bearish momentum.

The histogram shows a decreasing negative momentum, indicating that the selling pressure might be waning.

No clear divergence is visible between MACD and price action at this point.

Volume Analysis

A notable increase in volume is visible during the most recent decline, suggesting strong selling activity, possibly from institutional traders.

The high volume during the price decline supports the bearish trend continuation.

Volume trends align with the observed bearish sentiment.

Support & Resistance

Around 0.56000 mark, acting as immediate support.

The area around 0.57000 serves as a significant resistance, previously tested as a pivot point.

These levels could define the next moves, underscoring the current bearish trend.

Actionable Insights

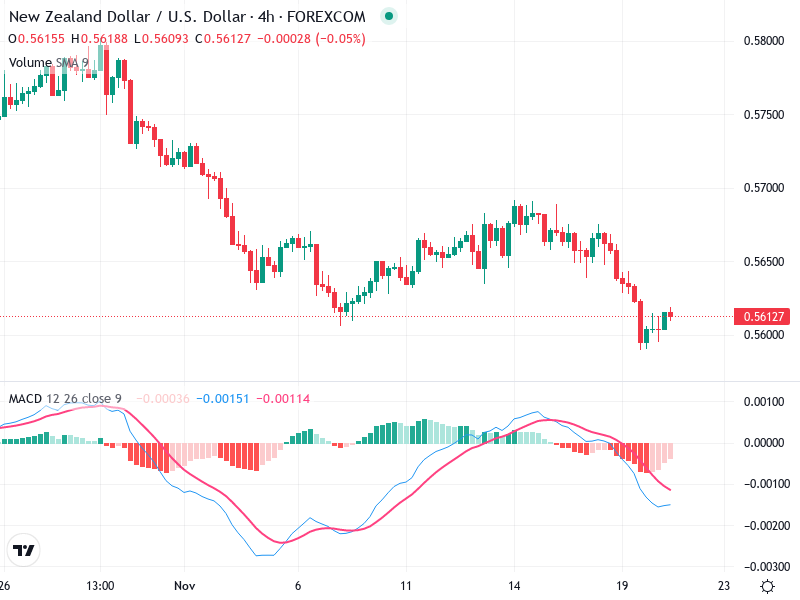
Consider holding or entering short positions if the price breaks below the current support at 0.56100 with high volume.

Watch for any bullish reversal signals, such as a bullish engulfing or confirmed hammer pattern, before changing bias to bullish.

It is crucial to set stop-loss orders just above recent resistance levels to manage risk exposure.

The AI Technical Analysis Center is an informational tool only and does not constitute investment or trading advice.
This site is registered on wpml.org as a development site. Switch to a production site key to remove this banner.