Generic selectors
Exact matches only
Search in title
Search in content
Post Type Selectors

Popular stocks

Crypto

CFD

Currencies

Support

Gold

NZD/USD – Technical Analysis – 4h

November 21, 2025 13:01

Quick Summary

The NZD/USD chart is experiencing a consolidation phase after a bearish trend. The presence of significant candlestick patterns and key support and resistance levels highlight potential trading opportunities. Traders should pay attention to technical indicators for deciding the next move in this forex pair.

Candlestick Analysis

Significant candlestick patterns include small-bodied candles with long wicks, indicating indecision in the market. These resemble doji patterns.

The overall trend shows a bearish movement transitioning into sideways action, leading to potential trader indecision.

A breakout or pullback zone is identified around the 0.56500 level, where prices have previously reversed.

MACD Analysis

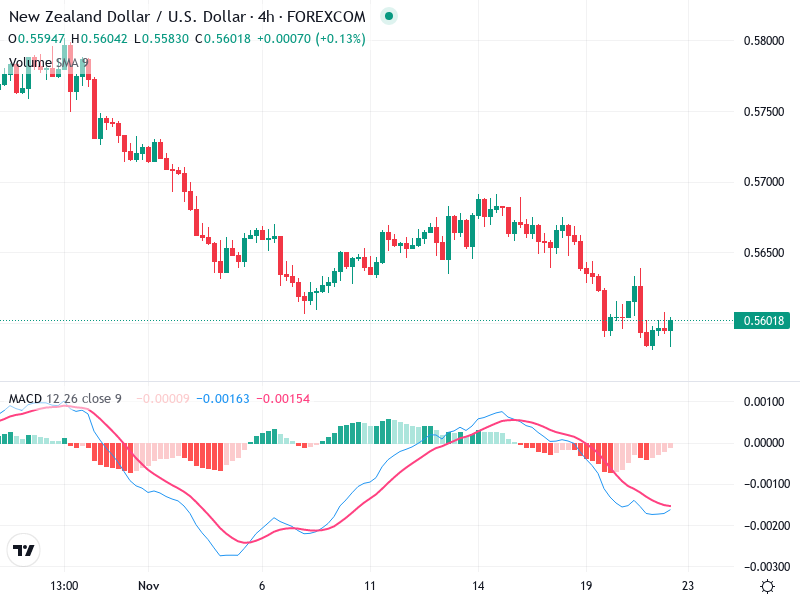
The MACD line is slightly below the Signal line, suggesting bearish sentiment, but the close proximity of both lines indicates potential for a crossover.

The MACD histogram displays decreasing negative momentum, hinting at a reduction in bearish strength.

Currently, there are no visible divergences between MACD and price action.

Volume Analysis

Volume remains consistent without major spikes, reflecting stable trading activity and no significant institutional interest at present.

Recent significant price movements are not strongly supported by volume.

If there are any volume spikes, they are not prominent on this chart timeframe.

Support & Resistance

Resistance is noted around 0.564000.56500, a level tested multiple times.

Support is approximately at 0.55600, where the price has recently bounced back.

These levels are crucial for identifying potential reversals or breakouts. A sustained move above resistance may signal a trend change.

Actionable Insights

Consider holding until a clearer trend change or breakout occurs.

A bullish MACD crossover with a breakout above 0.56500 may signal a buy opportunity.

A breakdown below 0.55600 with rising volume could indicate a sell.

The AI Technical Analysis Center is an informational tool only and does not constitute investment or trading advice.
This site is registered on wpml.org as a development site. Switch to a production site key to remove this banner.