Generic selectors
Exact matches only
Search in title
Search in content
Post Type Selectors

Popular stocks

Crypto

CFD

Currencies

Support

Gold

NZD/USD – Technical Analysis – 4h

November 24, 2025 13:01

Quick Summary

The chart analysis indicates a strategic consolidation phase for the asset.

The asset appears to be navigating through key support and resistance levels.

Candlestick Analysis

The overall trend appears to be bearish, with lower highs and lower lows forming on the chart.

There are no distinct bullish or bearish reversal patterns like engulfing patterns or dojis in the recent past, but the presence of longer wicks indicates some indecision.

The range around 0.56500 appears to have been a recent support that turned into a resistance zone.

MACD Analysis

The MACD line (blue) is converging towards the signal line (red) after having been below it, indicating a potential bullish crossover imminent or occurring.

The histogram shows reduced bearish momentum as it trends towards zero, suggesting weakening selling pressure.

No clear divergence between MACD and price action, but a lessening of bearish momentum is noted.

Volume Analysis

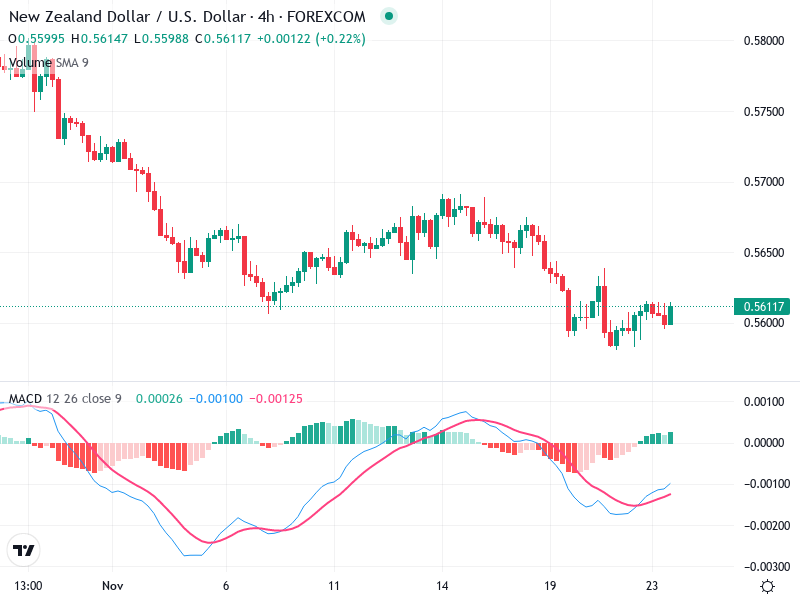
Recent volume is relatively stable without significant spikes, indicating a lack of strong buying or selling pressure.

The low volume might not strongly support substantial price movements, suggesting potential continuation of sideways action or limited breakout strength.

No significant volume spikes are present, indicating absence of notable institutional activity.

Support & Resistance

Around 0.55900 is a critical support level where prices have consistently tested but held.

Near 0.56500 is a key resistance, previously acting as support, likely to challenge any bullish attempts.

These levels are crucial for traders navigating potential price shifts.

Actionable Insights

Consider entering a buy position on confirmation of a bullish MACD crossover, with attention to the resistance at 0.56500 for potential breakout opportunities.

Watch for rejection around 0.56500 for potential selling opportunities or a bearish reversal pattern.

Holding might be prudent until clearer signals emerge, given the current lack of decisive trends.

The AI Technical Analysis Center is an informational tool only and does not constitute investment or trading advice.
This site is registered on wpml.org as a development site. Switch to a production site key to remove this banner.