Generic selectors
Exact matches only
Search in title
Search in content
Post Type Selectors

Popular stocks

Crypto

CFD

Currencies

Support

Gold

NZD/USD – Technical Analysis – 4h

November 28, 2025 13:00

Quick Summary

This technical analysis provides insights into the recent market movements of . The focus is on key indicators such as candlesticks, MACD, and volume to assess the current trend. In addition, support and resistance levels are highlighted to aid in potential trading decisions.

Candlestick Analysis

The chart shows a strong bullish movement with a large green candle indicating upward momentum, followed by a few smaller candles.

This pattern suggests bullish continuation but with caution due to the smaller subsequent candles.

The trend on the 4-hour chart appears bullish, particularly considering the recent surge in price from 0.5600 to 0.5720.

MACD Analysis

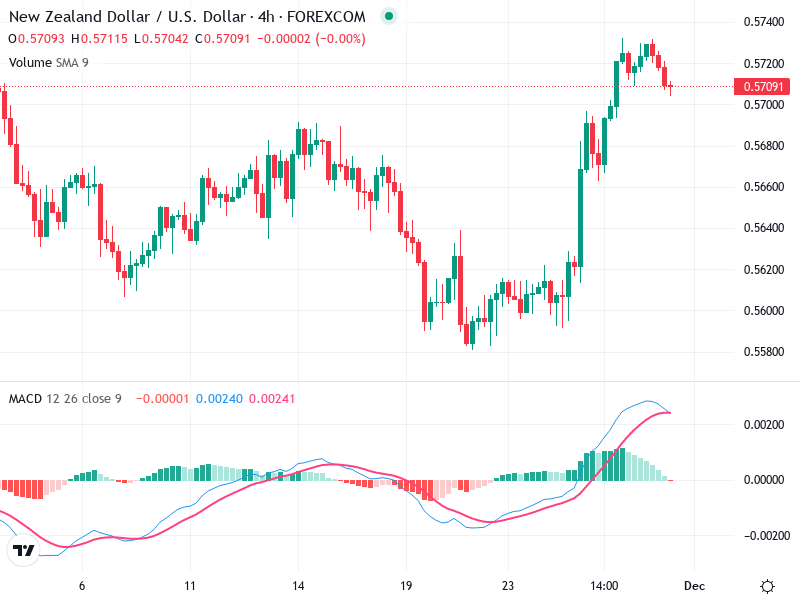
There was a recent bullish crossover where the MACD line crossed above the Signal line, which usually indicates positive momentum.

The histogram is currently showing positive bars, supporting the bullish movement. However, the bars appear to be shortening, suggesting a potential slowdown in momentum.

No significant divergences are observed between the MACD and price at present.

Volume Analysis

There was a noticeable increase in volume during the recent price surge. This supports the bullish price action, indicating strong buying interest.

The volume spikes align with the price increase, suggesting possible institutional involvement or increased trader interest.

This volume activity confirms the ongoing bullish sentiment in the market.

Support & Resistance

A key support level is around 0.5650, where the price previously broke out. This zone might be tested if a pullback occurs.

The current resistance is around 0.5720. If the price sustains above this, further upside could be expected.

Monitoring these levels closely can provide critical insights into potential price movements.

Actionable Insights

Consider buying if the price sustains above 0.5720 with increasing volume.

Watch for bearish candlestick patterns or a bearish MACD crossover for selling signals.

If holding a long position, monitor for a break below 0.5650 as a potential exit signal.

The AI Technical Analysis Center is an informational tool only and does not constitute investment or trading advice.
This site is registered on wpml.org as a development site. Switch to a production site key to remove this banner.