Generic selectors
Exact matches only
Search in title
Search in content
Post Type Selectors

Popular stocks

Crypto

CFD

Currencies

Support

Gold

NZD/USD – Technical Analysis – 4h

December 9, 2025 13:00

Quick Summary

The NZD/USD 4-hour chart indicates a notable trend. The asset has shown signs of a persistent bullish trend. Recent price actions and technical indicators suggest potential future movements.

Candlestick Analysis

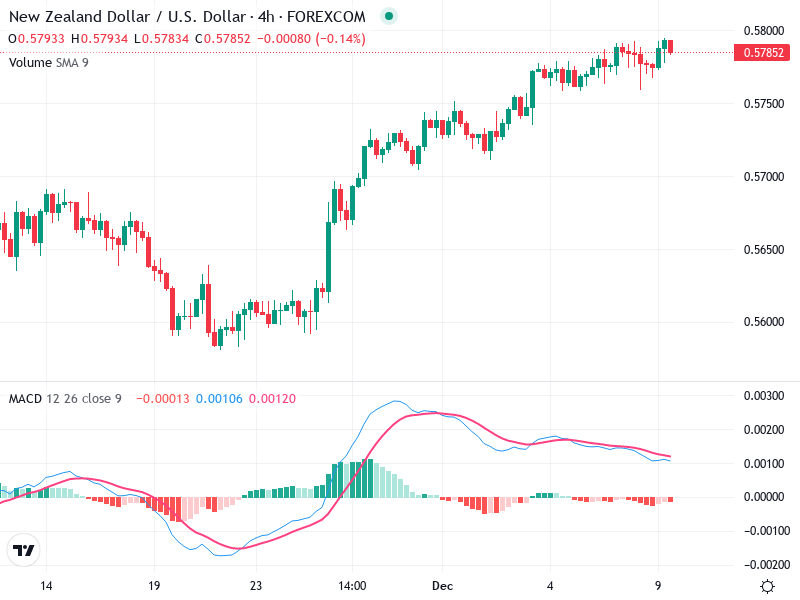
The chart displays a clear bullish trend from mid-November to date, characterized by a series of higher highs and higher lows.

Recently, there seems to be a small consolidation, but no significant candlestick patterns like bullish engulfing or doji are prominently visible at the current end.

The recent movement approaching 0.57852 may signal an attempt to break out above recent highs. The ability to sustain above this level can be significant for further upward movement.

MACD Analysis

The MACD line (blue) is above the Signal line (red), indicating a bullish crossover. This suggests continuing upward momentum.

The histogram is slightly above zero and contracting, indicating that the bullish momentum might be weakening unless a new price rally follows.

There doesn’t appear to be a clear divergence between MACD and price action at this moment.

Volume Analysis

Volume appears consistent with a slightly rising trend during recent price upticks, indicating support for the upward movement.

No significant volume spikes suggest a lack of strong institutional activity at the moment.

Support & Resistance

Immediate resistance is around the 0.58000 mark. A breakout above this level could confirm a continuation of the bullish trend.

Immediate support is around 0.57000, aligned with prior consolidation zones. A fall below this may signal a short-term reversal.

Actionable Insights

Consider entering long positions if the price breaks and holds above 0.58000 with increasing volume, confirming bullish momentum.

Initiate short positions if there is a clear reversal pattern or the price falls below the 0.57000 support with declining MACD.

Current holders could maintain positions while watching for new breakout confirmations or signs of trend reversal.

The AI Technical Analysis Center is an informational tool only and does not constitute investment or trading advice.
This site is registered on wpml.org as a development site. Switch to a production site key to remove this banner.