

The NZD/USD chart shows a bullish trend with upward momentum evident in recent price movements.
The asset is poised with potential for further gains if key levels hold.
This analysis focuses on candlestick, MACD, volume trends, and support/resistance levels.
The overall trend on this 4-hour chart for NZD/USD appears bullish, with a series of higher highs and higher lows forming.
There are minor bullish patterns such as consecutive green candles indicating upward momentum. However, no major candlestick patterns like bullish engulfing or doji are evident.
The recent breakout above 0.5800 could suggest continued bullish momentum if the level holds as support.
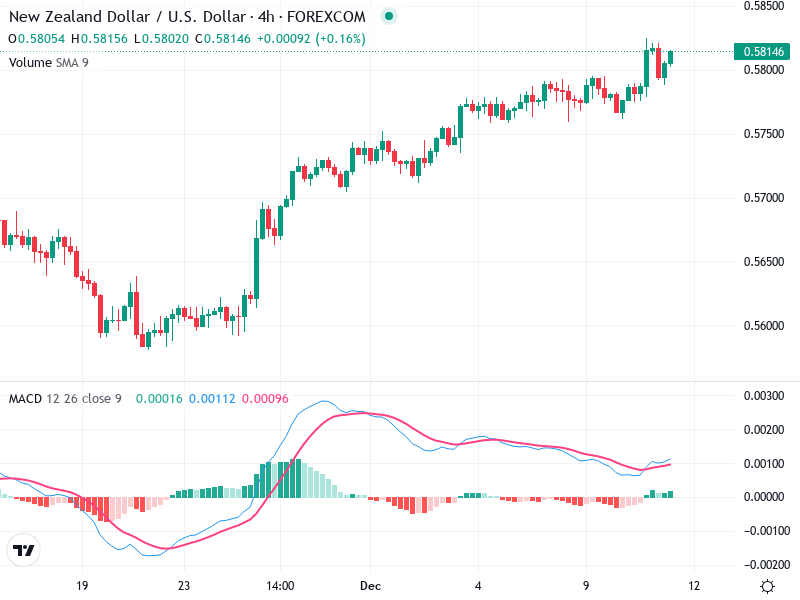
The MACD line is above the Signal line, indicating a bullish crossover which suggests upward momentum.
The histogram is in positive territory, reinforcing the bullish sentiment and indicating increasing momentum.
No clear divergence between the MACD and price action, indicating that the momentum aligns with the price trend.
Volume appears relatively stable with no significant spikes, indicating steady buying interest.
The absence of high volume spikes suggests lack of major institutional moves, but consistent volume supports the current uptrend.
Consistent volume trends align with a bullish sentiment under current conditions.
Key support lies around the 0.5800 level, recently broken and potentially turned from resistance to support.
Immediate resistance can be observed near the recent high around 0.5820.
The focus is on these levels to gauge future price action potential.
Consider buying if the price consolidates above 0.5800 and shows further bullish candlestick patterns.
Watch for bearish patterns or MACD crossovers for potential exit signals.
If currently holding long positions, continue to watch for any signs of weakening momentum or downward reversals.