Generic selectors
Exact matches only
Search in title
Search in content
Post Type Selectors

Popular stocks

Crypto

CFD

Currencies

Support

Gold

NZD/USD – Technical Analysis – 4h

December 16, 2025 13:01

Quick Summary

The NZD/USD chart provides crucial insights into market trends. Candlestick patterns are pivotal in signaling potential price movements. This analysis delves into various technical indicators to offer a comprehensive view.

Candlestick Analysis

The chart displays an overall bullish trend from late November to early December, followed by a sideways to slight bearish trend.

No clear bullish engulfing or hammer patterns are noted. Some doji and spinning tops appear, indicating indecision and potential reversals.

The price shows a consolidation pattern after a rally, with no significant breakout evident yet.

MACD Analysis

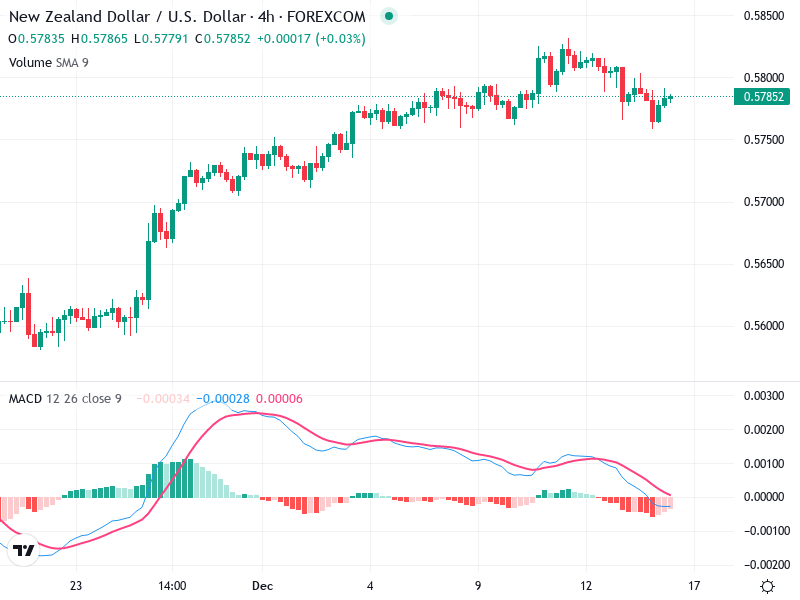
The MACD line is below the Signal line, indicating a bearish sentiment. A recent attempt at convergence suggests potential change.

The histogram shows decreasing negative momentum, hinting at a possible trend reversal or weakening bearish momentum.

No clear divergence is observed between MACD and price action, but watch for potential bullish divergence if prices start rising.

Volume Analysis

Volume has decreased as the price consolidated, which is typical, as traders await a breakout or new trend direction.

No unusual spikes are noted, indicating no significant institutional activity at the moment.

Watch for any volume changes to signal new trading opportunities.

Support & Resistance

Key support is around the 0.5750 level, as the price has repeatedly bounced from this zone.

Resistance is noted near 0.5800, which the price struggles to break above consistently.

Monitoring these levels is important for anticipating market movement.

Actionable Insights

Given the current sideways trend and MACD positioning, a wait-and-see approach might be prudent.

Traders could look to buy if a bullish MACD crossover confirms a breakout above 0.5800 with increased volume.

A breakdown below 0.5750 with volume might suggest further downside potential.

The AI Technical Analysis Center is an informational tool only and does not constitute investment or trading advice.
This site is registered on wpml.org as a development site. Switch to a production site key to remove this banner.