March 10, 2026 13:04 GBP/USD – Technical Analysis – 4h The GBP/USD 4-hour chart reveals significant bullish patterns. Key indicators suggest a shift in momentum to the upside.
March 10, 2026 13:02 AUD/USD – Technical Analysis – 4h The chart for the asset shows a promising setup for traders. Recent indicators highlight key support and resistance levels. The asset has shown characteristics that…
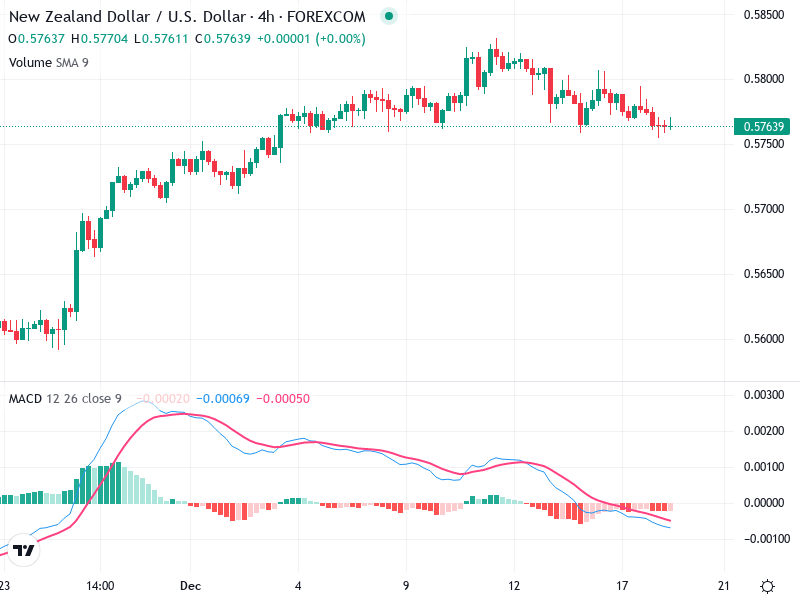
March 10, 2026 13:00 NZD/USD – Technical Analysis – 4h The asset’s chart reveals key insights about potential market movements. Recent patterns indicate potential shifts in momentum. Traders should monitor these signals closely. The asset…