Generic selectors
Exact matches only
Search in title
Search in content
Post Type Selectors

Popular stocks

Crypto

CFD

Currencies

Support

Gold

NZD/USD – Technical Analysis – 4h

December 22, 2025 13:01

Quick Summary

The New Zealand Dollar/U.S. Dollar (NZD/USD) chart displays a sideways trend with a bullish inclination on recent moves.

The asset’s performance is closely tied to key resistance and support levels that signal potential market shifts.

Ongoing analysis is required to gauge further movements and potential trading opportunities.

Candlestick Analysis

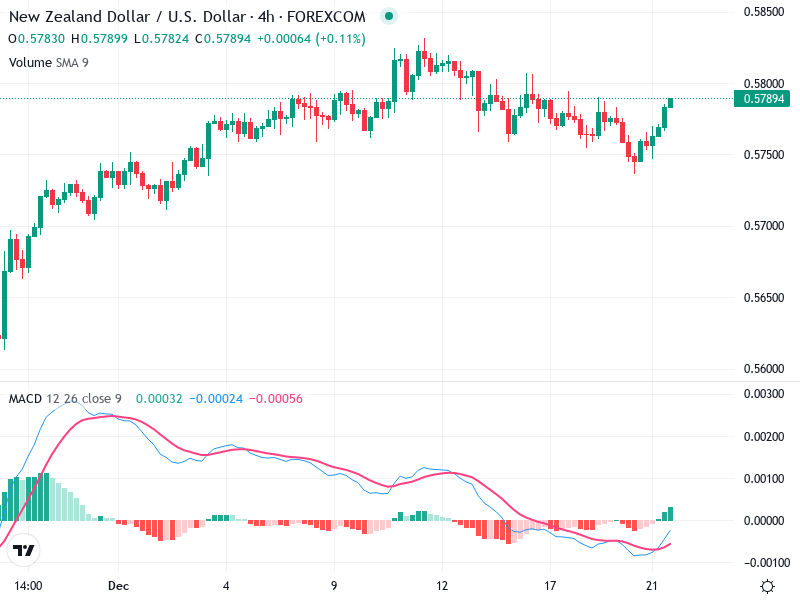
The overall trend of the NZD/USD appears sideways with a slight bullish inclination as evidenced by recent upward moves.

There is a recent bullish momentum seen in the presence of multiple consecutive green candles, indicating buying pressure.

A few sessions ago, a reversal pattern can be observed resembling a potential double bottom around 0.57300, suggesting a possible end to the preceding downtrend.

MACD Analysis

The MACD line has recently crossed above the Signal line, signaling a bullish crossover. This is often considered an early indicator of a positive price movement.

The MACD histogram is also moving upward, reinforcing the bullish sentiment as it indicates rising momentum.

No clear divergence is observed currently, aligning price action and momentum.

Volume Analysis

There is an increase in volume accompanying the recent price rise. This supports the bullish move, indicating strong buying interest.

No unusual spikes visible, suggesting stable trading activity, though the increased volume does suggest some level of institutional interest aligning with current movements.

The volume trends indicate sustained interest that may support further upward movement.

Support & Resistance

Around 0.57300, previously acting as a double bottom, signifies strong buying interest in that zone.

Close to 0.58000, recent attempts to break this level are evident. Watch for a potential breakout in this area as it may hint at increased bullish activity.

Monitoring the dynamic support and resistance levels is crucial for predicting future price action.

Actionable Insights

A breakout above 0.58000 with sustained volume could be a buy signal for traders looking to capitalize on bullish momentum.

If price retreats from 0.58000 with a drop in volume, it may present a selling opportunity.

For existing longs, maintaining positions while watching for confirmation of a breakout above resistance may be prudent.

The AI Technical Analysis Center is an informational tool only and does not constitute investment or trading advice.
This site is registered on wpml.org as a development site. Switch to a production site key to remove this banner.