Generic selectors
Exact matches only
Search in title
Search in content
Post Type Selectors

Popular stocks

Crypto

CFD

Currencies

Support

Gold

NZD/USD – Technical Analysis – 4h

December 23, 2025 13:00

Quick Summary

The chart for the asset indicates a consistent bullish momentum, as evidenced by the indicators. The recent trends show a potential for further upward movement, supported by significant trading volume and MACD signals.

This analysis highlights breakout patterns, signaling a shift in market sentiment towards a bullish outlook for the asset.

Candlestick Analysis

The recent candlesticks display a strong green bullish momentum, indicating a potential bullish trend.

There doesn't seem to be a specific pattern like a bullish engulfing or hammer, but the sustained upward motion is notable.

The recent upward movement suggests a breakout from the earlier sideways trend that was evident.

MACD Analysis

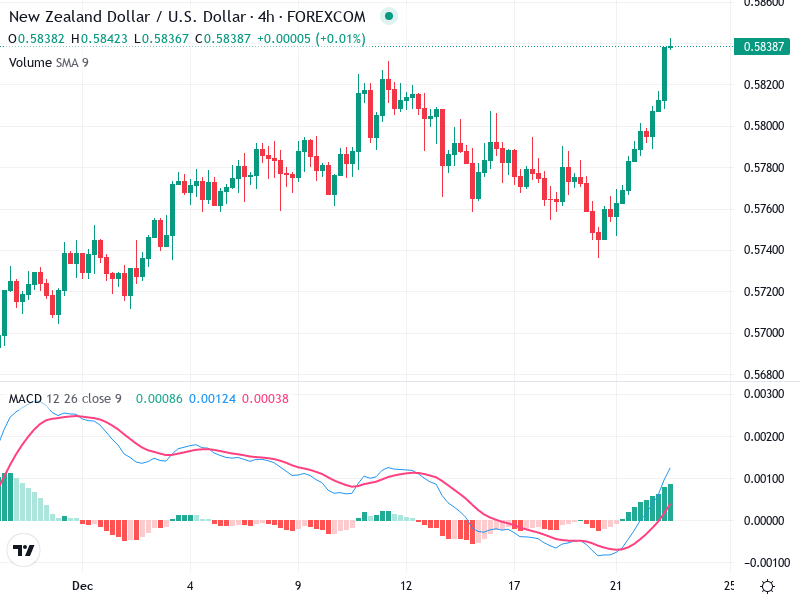
A bullish crossover has recently occurred, where the MACD line (blue) crossed above the Signal line (red), indicating a shift towards upward momentum.

The histogram bars are increasingly positive, suggesting growing bullish momentum. This supports the current upward price trend.

No clear divergence is visible between the MACD and price action, supporting the recent price trend.

Volume Analysis

There's an increase in volume accompanying the price rise, which supports the strength of the upward movement.

The rising volume in parallel with rising prices suggests confirmation of the bullish breakout.

While no extreme spikes are visible, the rising volume trend suggests increasing market interest, possibly institutional.

Support & Resistance

Resistance was broken near 0.57800, which may now act as support.

Immediate resistance levels might be targeted next as prices continue upward.

These levels are crucial for validating the recent breakout. If prices hold above previous resistance, it could confirm the trend continuation.

Actionable Insights

Consider buying on minor pullbacks, especially if prices hold above recent resistance turned support.

If already in position, holding as long as bullish momentum continues and no reversal signals appear is advisable.

Watch for overextension signals or reversal patterns before considering selling.

The AI Technical Analysis Center is an informational tool only and does not constitute investment or trading advice.
This site is registered on wpml.org as a development site. Switch to a production site key to remove this banner.