Generic selectors
Exact matches only
Search in title
Search in content
Post Type Selectors

Popular stocks

Crypto

CFD

Currencies

Support

Gold

NZD/USD – Technical Analysis – 4h

December 25, 2025 13:00

Quick Summary

The Stock chart indicates a bullish trend with a recent breakout following a consolidation period. It suggests continuing upward movement with strong buying pressure.

Monitoring key support and resistance levels can provide insights for potential strategies.

Candlestick Analysis

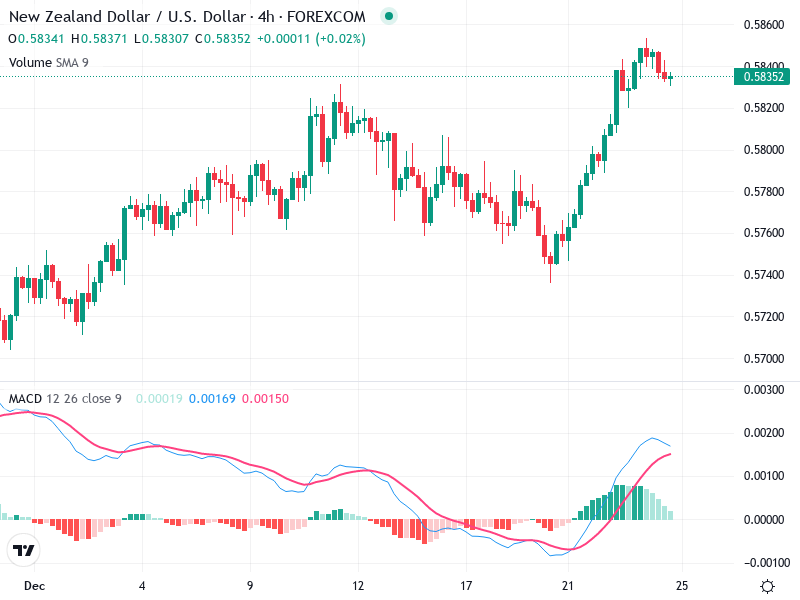
The overall trend in the chart is bullish. The price action has shown a recent upward momentum after a period of consolidation.

There appears to be a breakout to the upside, marked by long bullish candles around the 20th, indicating strong buying pressure.

The breakout occurred around the $0.5800 level, and the price is currently experiencing a slight pullback but remains above this level.

MACD Analysis

The MACD line is above the Signal line, signaling a bullish crossover that often indicates a continuation of the current uptrend.

The histogram shows increasing positive momentum, suggesting that the bullish momentum is strong.

No significant divergences are noticeable; the MACD supports the price trend.

Volume Analysis

There is a noticeable increase in volume during the breakout phase, which adds credibility to the bullish move.

The volume supports the recent price increase, suggesting that the upward movement is supported by strong trading activity.

No distinct spikes in volume that suggest unusual activity, but consistent volume increase indicates institutional interest.

Support & Resistance

The $0.5800 level acts as a key support zone after the breakout.

Around $0.5860, where previous highs might pose resistance.

Maintaining above the support level strengthens the bullish outlook, while breaking resistance could trigger a further upward move.

Actionable Insights

Consider buying on pullbacks to the support level of $0.5800 if the price shows strong bullish candlestick formations.

For those already long, maintain positions unless the price falls below the support level with increasing volume.

Watch for signs of bearish reversal patterns or a bearish MACD crossover.

The AI Technical Analysis Center is an informational tool only and does not constitute investment or trading advice.
This site is registered on wpml.org as a development site. Switch to a production site key to remove this banner.