Generic selectors
Exact matches only
Search in title
Search in content
Post Type Selectors

Popular stocks

Crypto

CFD

Currencies

Support

Gold

NZD/USD – Technical Analysis – 4h

January 1, 2026 13:00

Quick Summary

The NZD/USD 4-hour chart displays significant bearish trends with potential short-term stabilization. The asset’s price action shows a downtrend with key levels to watch for future movements.

Potential breakout and pullback zones have been identified, along with action-indicating patterns that could shape near-term strategies.

Candlestick Analysis

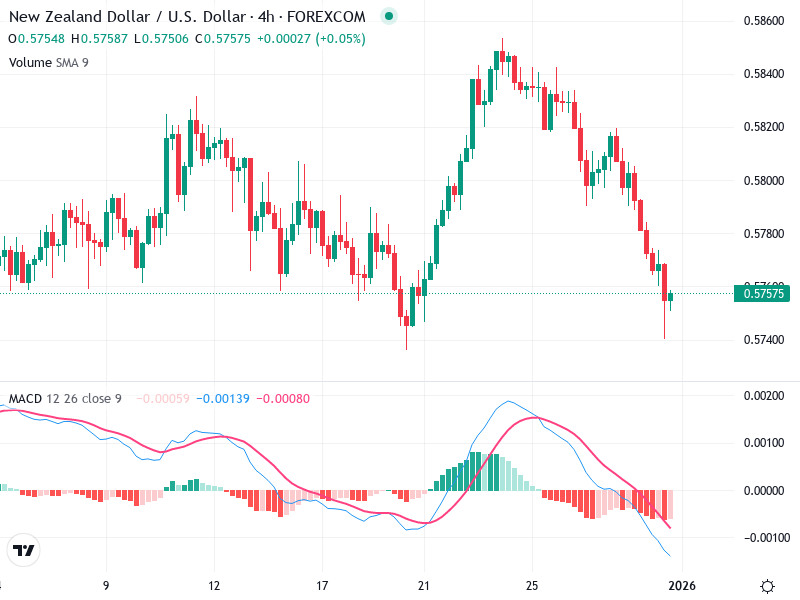
Recently, there is the presence of a potential hammer-like pattern forming, which could indicate a possible reversal or price stabilization in the near term after a significant downtrend.

The recent price action shows a bearish trend, with a series of lower highs and lower lows culminating in the recent down move.

A breakout occurred around 0.5820, leading to the current downtrend towards the 0.5750 area. Potential pullback towards the previous support at 0.5780 can be expected.

MACD Analysis

The MACD line is below the Signal line, indicating bearish momentum. There has been a recent bearish crossover.

The MACD histogram shows increasing negative bars, suggesting strengthening bearish momentum.

No significant divergence observed currently, as both MACD momentum and price action confirm the downtrend.

Volume Analysis

There is a moderate increase in volume observed during the recent decline, which supports the downside move and suggests it was backed by significant trading activity.

A volume spike during the downward move can indicate institutional activity driving the price lower.

Support & Resistance

Support: Around 0.5750, which the price has recently touched and is looking to stabilize.

Resistance: Previous pivots at 0.5800 and 0.5820 due to past interaction and price action.

The 0.5750 level is critical for a potential short-term rebound. A break below could indicate further downside risk.

Actionable Insights

Sell/Short: Consider selling or shorting if the price breaks below 0.5750 with increased volume, targeting further downside.

Buy/Long: A cautious buy signal if the price can reclaim 0.5780 with a forming bullish candlestick pattern and increased volume.

Watch for MACD signal changes or bullish candlestick formations at current levels as a potential sign of reversal or stabilization.

The AI Technical Analysis Center is an informational tool only and does not constitute investment or trading advice.
This site is registered on wpml.org as a development site. Switch to a production site key to remove this banner.