Generic selectors
Exact matches only
Search in title
Search in content
Post Type Selectors

Popular stocks

Crypto

CFD

Currencies

Support

Gold

NZD/USD – Technical Analysis – 4h

January 7, 2026 13:00

Quick Summary

The chart of displays notable technical patterns that investors should consider.

Technical indicators like candlestick formations, MACD, and volume provide insights into potential future movements of .

Traders need to monitor breakout and pullback zones for guided decisions.

Candlestick Analysis

The current trend shows an overall sideways movement with recent slight upward momentum, suggesting a potential bullish reversal.

There are no major reversal patterns such as a hammer or bullish engulfing in the recent segment of the chart, indicating a level of indecision.

Breakout or pullback zones are identified around the recent peaks at 0.5800 and the troughs near 0.5760.

MACD Analysis

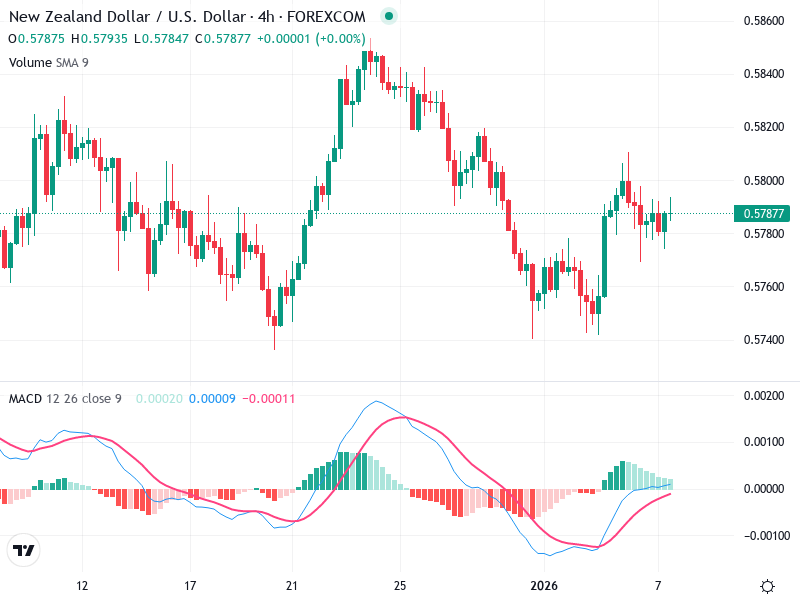
The MACD line has recently crossed above the Signal line, indicating a bullish crossover and potential upward momentum.

The histogram is positive, which supports the bullish sentiment, though the upward momentum appears moderate.

There are no significant divergences between the MACD and the price action, aligning the indicators with current price trends.

Volume Analysis

The volume levels appear stable, lacking significant spikes, which implies a lack of strong buying or selling pressure.

The stability in volume aligns with the current sideways price trend.

No clear signs of unusual spikes suggest limited institutional activity in recent sessions.

Support & Resistance

A key support level is around 0.5760, previously tested and may serve as a potential bounce-back point.

The resistance level is near 0.5800, acting as a ceiling for upward price movements.

These levels are crucial for identifying potential breakout or breakdown points in price action.

Actionable Insights

Consider a buy strategy upon confirmation of the price breaking above the resistance level at 0.5800 with increased volume and supportive bullish MACD.

Exercise caution for potential declines if the price fails to sustain above 0.5800, and monitor for a possible bearish MACD crossover.

Holding current positions may be advisable until a clearer trend is established, based on breakout confirmations and volume signals.

The AI Technical Analysis Center is an informational tool only and does not constitute investment or trading advice.
This site is registered on wpml.org as a development site. Switch to a production site key to remove this banner.