Generic selectors
Exact matches only
Search in title
Search in content
Post Type Selectors

Popular stocks

Crypto

CFD

Currencies

Support

Gold

NZD/USD – Technical Analysis – 4h

January 9, 2026 13:00

Quick Summary

The chart showcases significant movements in the asset’s price. Recent indicators suggest potential shifts in momentum. Market sentiment is closely aligned with key technical levels.

Candlestick Analysis

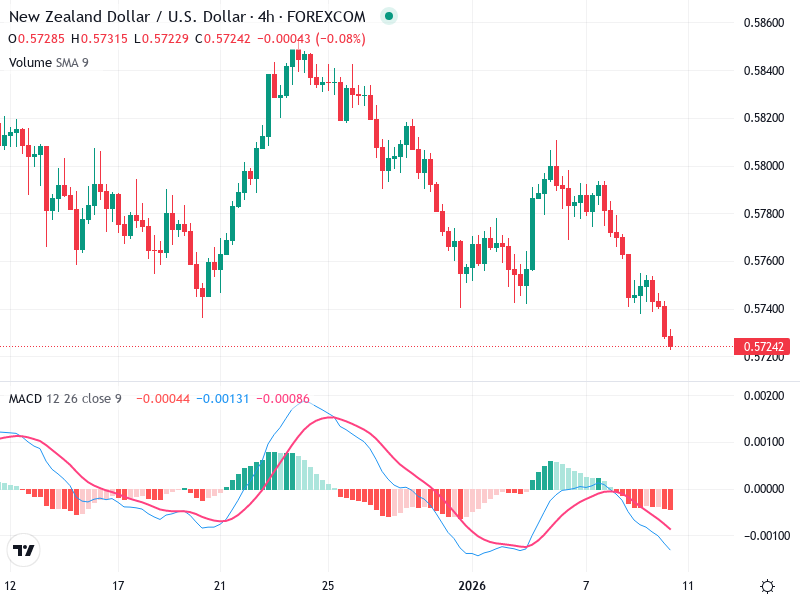
The chart exhibits a series of red candlesticks, indicating a bearish trend.

A potentially significant pattern is forming near the current price, such as a possible hammer, which could suggest a reversal if the next candlestick confirms it.

The market has been in a bearish trend recently, with lower highs and lower lows evident on the chart.

MACD Analysis

The MACD line is below the Signal line, indicating a bearish crossover. This suggests continued downward momentum.

The histogram shows negative bars, corroborating the bearish momentum but showing signs of potential narrowing, which might indicate waning bearish strength.

There doesn't appear to be a significant divergence between the MACD and price action at this time.

Volume Analysis

Volume levels have been relatively stable, with a slight increase during recent declines, supporting the bearish trend.

The consistent volume with the downtrend suggests genuine selling pressure rather than short-term volatility.

No significant unusual spikes in volume that stand out as indicative of institutional activity.

Support & Resistance

The key support level is near 0.57200, where the price is hovering.

A break below this could lead to further downside.

Immediate resistance is near 0.57450, where recent minor pullbacks have failed.

Actionable Insights

If the price breaks below 0.57200 with strong volume, it may be a signal to sell or take a short position.

If a hammer pattern forms and is confirmed, consider a cautious buy with tight stop-losses above this level.

Monitor for a confirmation of the potential reversal pattern or a decisive break below the current support level.

The AI Technical Analysis Center is an informational tool only and does not constitute investment or trading advice.
This site is registered on wpml.org as a development site. Switch to a production site key to remove this banner.