Generic selectors
Exact matches only
Search in title
Search in content
Post Type Selectors

Popular stocks

Crypto

CFD

Currencies

Support

Gold

NZD/USD – Technical Analysis – 4h

January 16, 2026 13:01

Quick Summary

The chart for reveals the asset’s current status in the market.

The analysis provides insights into potential future movements.

Understanding key levels can aid in making informed decisions.

Candlestick Analysis

The overall trend appears to be sideways, with no clear bullish or bearish momentum overpowering the other.

There are no prominent candlestick patterns like bullish engulfing or doji in recent sessions. There is some consolidation, indicating indecision in the market.

Recent candles suggest resistance around 0.5780 with potential support near 0.5740. Price needs to decisively break above resistance or below support for a clearer direction.

MACD Analysis

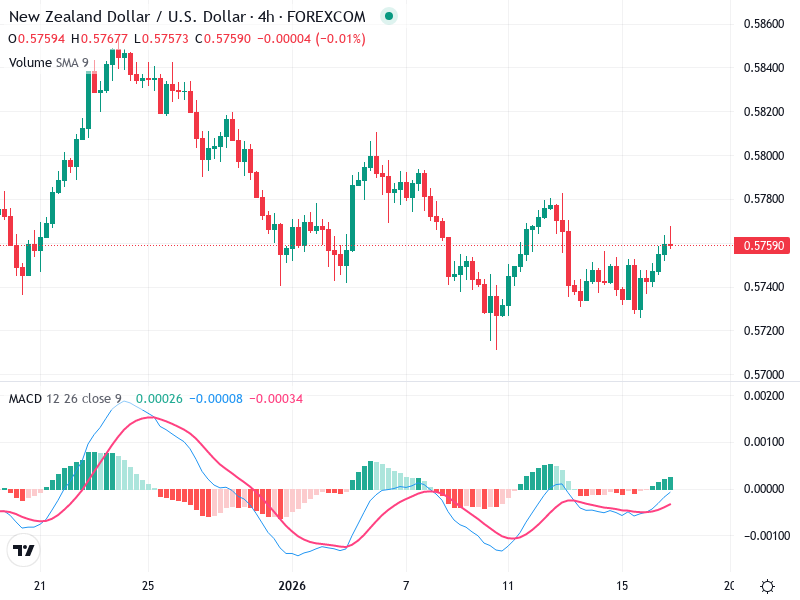
The MACD line is close to crossing above the Signal line, suggesting the possibility of a bullish crossover. However, the lines are relatively flat, showing lack of strong momentum.

The histogram is slightly positive, indicating mild bullish momentum, though it's not significant enough to suggest a strong buying signal.

Currently, no significant divergence between MACD and price action. Price and MACD are generally in agreement.

Volume Analysis

Volume appears consistent with the past few sessions, without any significant spikes, suggesting steady trading activity without strong institutional activity.

The lack of unusual volume reduces the likelihood of strong price moves in either direction at this time.

Observing volume alongside price action can provide insights into market sentiment.

Support & Resistance

Key support is around 0.5740. A break below this level could indicate further downside potential.

Resistance is around 0.5780. A successful break above this could be seen as a bullish signal and might catalyze further upward movement.

Monitoring these levels can aid in determining potential market entry and exit points.

Actionable Insights

Consider buying if there is a breakout above 0.5780 with strong volume, supported by a clear bullish signal from MACD.

Selling could be considered if the price breaks below 0.5740, accompanied by increased volume and confirmation of MACD turning bearish.

If none of the breakout conditions are met, holding may be advisable given the current sideways movement.

The AI Technical Analysis Center is an informational tool only and does not constitute investment or trading advice.
This site is registered on wpml.org as a development site. Switch to a production site key to remove this banner.