The NZD/USD pair is showing signs of shifting from a bearish to a potentially bullish trend. Recent price actions are suggesting a possible breakout if current momentum holds. Traders should keep an eye on key levels for further confirmation.
Candlestick Analysis
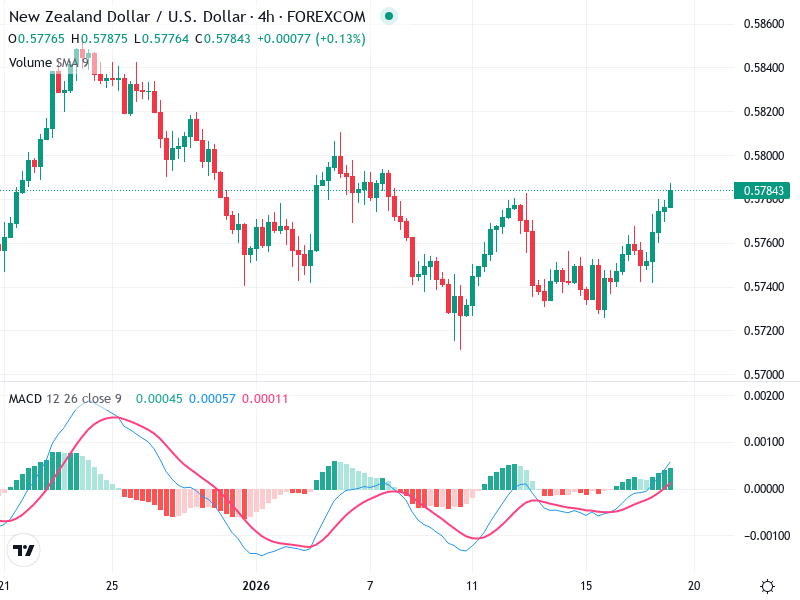
Recent candlesticks show a series of bullish candles, indicating potential bullish momentum.
No definitive reversal patterns are evident in the current price action.
A potential breakout zone is forming around the current price of 0.57843.
MACD Analysis
The MACD line is crossing above the Signal line, suggesting a bullish crossover.
The histogram is rising above the zero line, supporting bullish momentum.
No significant divergence is noted between the MACD and the price action.
Volume Analysis
Volume levels have been consistent with slight increases during recent bullish moves.
The volume uptick during bullish phases suggests buying interest is supporting the upward price movement.
No unusual spikes in volume suggest gradual support of price trends.
Support & Resistance
Key support level is around 0.57600, where previous price consolidation occurred.
Immediate resistance is around 0.58000, a psychological level.
A breach of 0.58000 is needed for further confirmation of a bullish trend.
Actionable Insights
Consider buying if the price breaks and holds above 0.58000 with increased volume.
Watch for potential bearish candlestick patterns around resistance for selling signals.
A return below 0.57600 with bearish momentum could suggest a sell strategy.
The AI Technical Analysis Center is an informational tool only and does not constitute investment or trading advice.