January 23, 2026 17:03
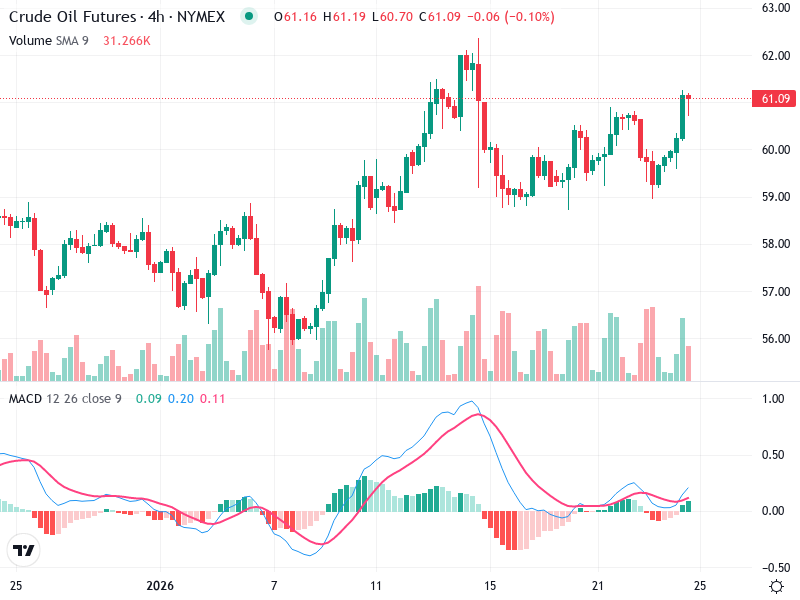
The Crude Oil Futures chart provides insights into the recent price dynamics and potential future movements. Key patterns and indicators are highlighted to guide trading decisions. This analysis examines crucial levels and momentum indicators to give a comprehensive view of the asset’s direction.
The chart shows a recent sequence where a bearish pattern formed after a strong bullish trend. This is important for identifying potential reversals.
Recent formations feature small-bodied candlesticks, indicating indecision or potential reversal zones.
The breakout at the 60 level is significant as it now acts as a resistance point, with the area around 58.8 potentially serving as short-term support.
A recent bearish crossover on the MACD line signals potential downward momentum.
The MACD line is trending below the signal line, reinforcing the bearish outlook.
The MACD histogram shows expanding negative bars, which suggest increasing bearish momentum.
Volume was higher during the bullish rally, supporting the upward movement.
There is a slight decrease in volume, reflecting reduced trading interest during the pullback.
No unusual spikes indicate strong institutional buying or selling.
Around 58.8 acts as a crucial support level formed from previous consolidation.
Resistance is clearly marked at 60; a break above this could resume the upward trend.
Monitoring these levels is key for anticipating possible trend shifts.
Consider entering a short position if the price fails to break above the 60 resistance, targeting near the support zone at 58.8.
Consider a buy above the resistance of 60 with confirmation from additional price strength and increased volume.
Watch for any reversal patterns like a bullish engulfing near support, indicating potential trend changes.