Generic selectors
Exact matches only
Search in title
Search in content
Post Type Selectors

Popular stocks

Crypto

CFD

Currencies

Support

Gold

OIL – Technical Analysis – 4h

January 26, 2026 17:01

Quick Summary

The chart for displays a strong upward trend after mid-section, characterized by higher highs and lows.

There are periods of consolidation suggesting potential areas of interest for traders.

Candlestick Analysis

The chart shows a bullish trend overall, with key candlestick patterns indicating potential upward momentum.

A bullish engulfing pattern suggests a significant directional reversal around the middle of the chart.

Numerous doji patterns are present, indicative of market indecision after sharp upward movements.

MACD Analysis

The MACD line is above the Signal line, indicating a recent bullish crossover and upward momentum.

The MACD histogram is positive but declining, hinting at waning momentum.

No significant divergences between MACD and price action confirm the existing trend.

Volume Analysis

Volume spikes align with price upswings, suggesting strong market interest during these phases.

A notable increase in volume at the $58 breakout area points to possible institutional buying.

The volume pattern supports recent price movements, reinforcing the current bullish trend.

Support & Resistance

Resistance is identified around the $62 mark, as several attempts to breach this level were met with pushbacks.

Support is clearly seen at approximately $58, which holds despite multiple tests, acting as a breakout level.

Price activity in these zones should be closely monitored for potential trading opportunities.

Actionable Insights

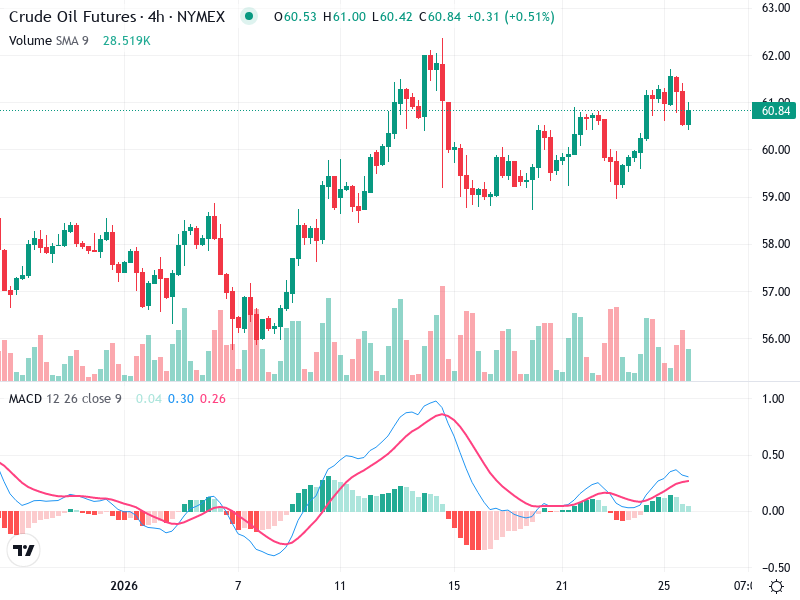
Consider entering buy positions around the $58 support mark, particularly if confirmed by bullish signals or increased volume.

Evaluate selling strategies near $62 unless breakout consolidation is supported by high trading volumes.

If the market consolidates with growing volume, maintaining current positions might prove advantageous, anticipating a potential breakout.

The AI Technical Analysis Center is an informational tool only and does not constitute investment or trading advice.
This site is registered on wpml.org as a development site. Switch to a production site key to remove this banner.