Generic selectors
Exact matches only
Search in title
Search in content
Post Type Selectors

Popular stocks

Crypto

CFD

Currencies

Support

Gold

OIL – Technical Analysis – 4h

January 29, 2026 17:01

Quick Summary

The chart for Crude Oil Futures displays a clear upward trajectory over the analyzed period. Significant patterns suggest a prevailing bullish trend with caution near potential resistance levels.

The recent price actions highlight critical zones for anticipated breakouts and reversals, providing key insights for traders.

Candlestick Analysis

The recent candlestick formation indicates a strong bullish trend with the latest candles showing potential exhaustion or pullback due to long wicks on top.

The overall trend remains bullish over the observed period, yet there are signs of potential consolidation or reversal near the peak.

The area around $66.00 serves as a potential breakout zone, while pullbacks could occur towards support around $64.00.

MACD Analysis

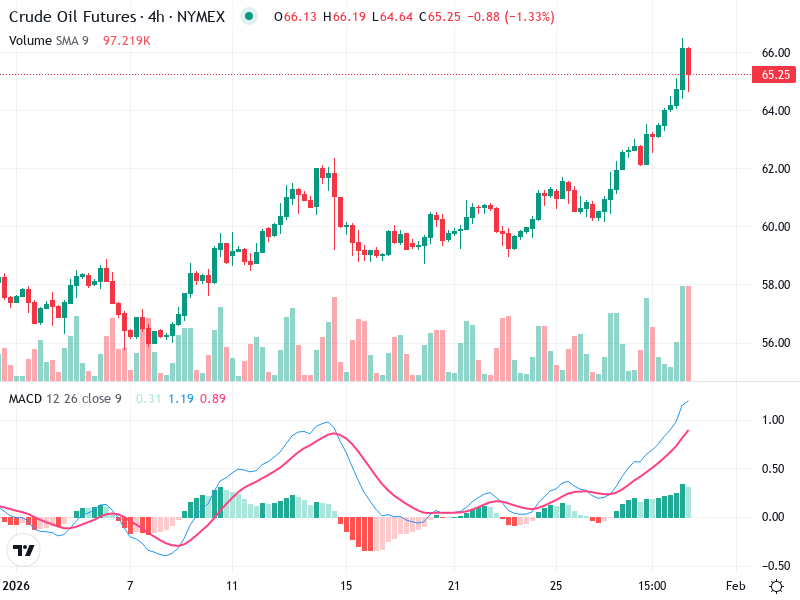
The MACD line is above the Signal line, indicating a recent bullish crossover. However, the narrowing gap suggests a potential slowdown in bullish momentum.

The histogram bars are declining after reaching a peak, implying decreasing bullish momentum and a possible crossover.

No significant divergence is observed presently, but monitoring for any negative divergence could signal bearish trends.

Volume Analysis

There is a noticeable spike in volume accompanying the price rise, confirming bullish momentum. Yet, the sudden high volume near the peak may indicate some level of distribution.

The strong volume supports the price increase, nevertheless, the spike could also signal a potential end to the bullish run.

Monitoring volume at critical levels is essential for anticipating future price movements.

Support & Resistance

Resistance exists around $66.00 - $66.50, with significant price saturation.

Support can be found at the $64.00 level, previously identified as a breakout zone.

Close attention to these levels can offer critical insights for decision-making.

Actionable Insights

Consider buying if there's a solid breakout and sustained movement above $66.50 with continued volume support.

If volume declines or price fails to maintain above $66.00, hold or consider taking profits.

Monitor the MACD for a bearish crossover and observe volume changes at resistance levels for potential bearish signals.

The AI Technical Analysis Center is an informational tool only and does not constitute investment or trading advice.
This site is registered on wpml.org as a development site. Switch to a production site key to remove this banner.