Generic selectors
Exact matches only
Search in title
Search in content
Post Type Selectors

Popular stocks

Crypto

CFD

Currencies

Support

Gold

OIL – Technical Analysis – 4h

September 4, 2025 07:09

Quick Summary

The analysis of the Crude Oil Futures chart reveals a prominent bearish sentiment. The chart is dominated by a consistent series of red candles, highlighting sustained selling pressure. Additionally, key support and resistance levels are observed, providing critical insights for potential future movements.

Candlestick Analysis

The chart shows a potential bearish engulfing pattern in the recent candles, indicating a possible continuation of the downward trend.

A doji was observed earlier, suggesting indecision before the recent downtrend.

Currently bearish. The recent series of red candles indicate selling pressure.

MACD Analysis

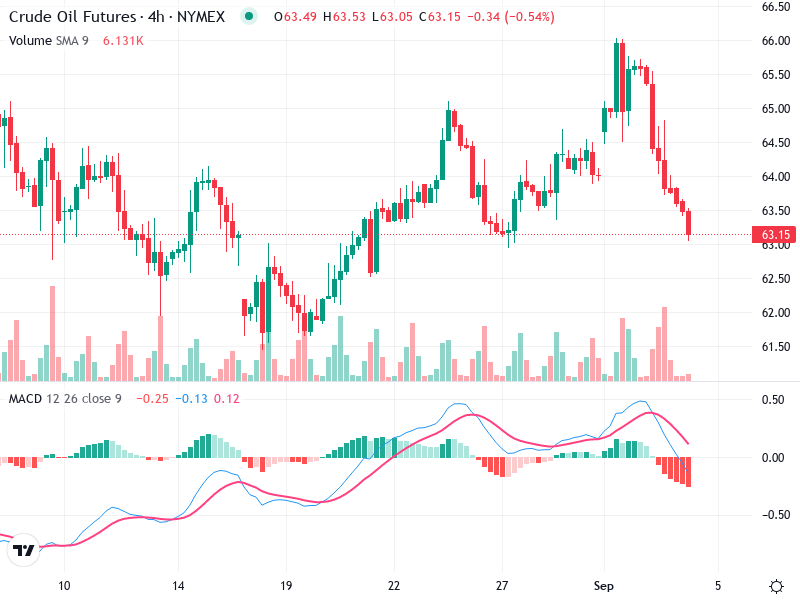
The MACD line has crossed below the Signal line, indicating a bearish crossover, which suggests increasing bearish momentum.

The histogram is in negative territory and expanding, supporting the bearish sentiment with growing momentum.

No significant divergences detected at this point between MACD and price action.

Volume Analysis

Volume has increased with the recent downtrend, confirming the strength of the current selling pressure.

Rising volume on the downward movement supports the current bearish price action.

Notable volume increase aligns with the decline, hinting at possible institutional activity or strong market sentiment.

Support & Resistance

Support: Around $62.50.

Resistance: Near $64.50, which aligns with past peaks before the recent decline.

Breach of $63.00 with volume could signal further downside. The $62.50 level will be crucial for observing potential reversal or consolidation.

Actionable Insights

Consider a sell position if the price breaks below $63.00 with increased volume.

Current holders might watch for a potential rebound at $62.50 before making any decisions.

Monitor for any signs of bullish reversal patterns or a change in volume trend as indicators for a change in momentum.

The AI Technical Analysis Center is an informational tool only and does not constitute investment or trading advice.
This site is registered on wpml.org as a development site. Switch to a production site key to remove this banner.