Generic selectors
Exact matches only
Search in title
Search in content
Post Type Selectors

Popular stocks

Crypto

CFD

Currencies

Support

Gold

OIL – Technical Analysis – 4h

February 5, 2026 17:01

Quick Summary

The Crude Oil Futures chart presents a bullish trend with consolidation. Recent candlestick patterns show indecisive movements, possibly indicating a pause or reversal. The MACD analysis reflects a recent bullish crossover, with volume supporting bullish sentiment.

Key levels are evident around 63.00 as support and 65.00 as resistance. Actionable insights suggest strategic buying and selling based on these levels and volume trends.

Candlestick Analysis

The chart depicts a bullish trend followed by some consolidation.

The recent candles show indecisive action, indicating a possible pause in the trend or a reversal.

The rally on Jan 27 indicates strong bullish candles exceeding previous highs, though current candles hint at consolidation.

MACD Analysis

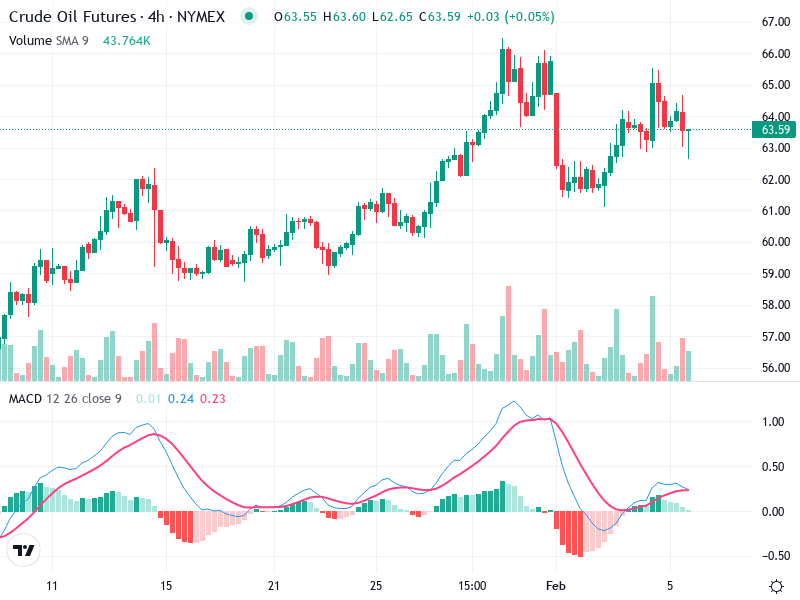
A recent bullish crossover occurred, as the MACD line crossed above the signal line.

The MACD histogram is just above zero, showing weak bullish momentum that requires confirmation.

There is no significant divergence, but momentum appears to be waning.

Volume Analysis

There has been a noticeable increase in volume during upward movements, indicating buying interest.

The recent price rise accompanied by strong volume supports a bullish outlook.

No extremely unusual spikes have been observed, suggesting stable trading activity.

Support & Resistance

Support is forming around 63.00, establishing a strong base from recent consolidation zones.

Resistance is approximately at 65.00, presenting a breakout zone for continued upward movement.

This resistance must be breached for confirmation of further bullish momentum.

Actionable Insights

Consider buying if the price breaks and sustains above 65.00 with strong volume and confirmed MACD momentum.

Be prepared to sell if the price falls below 63.00 with increased volume and a bearish MACD signal.

Maintain positions within the 63.00 to 65.00 range if no clear break occurs.

The AI Technical Analysis Center is an informational tool only and does not constitute investment or trading advice.
This site is registered on wpml.org as a development site. Switch to a production site key to remove this banner.