Generic selectors
Exact matches only
Search in title
Search in content
Post Type Selectors

Popular stocks

Crypto

CFD

Currencies

Support

Gold

OIL – Technical Analysis – 4h

February 10, 2026 17:00

Quick Summary

In this analysis, we examine the recent movements of Crude Oil Futures on a 4-hour NYMEX chart. The asset has displayed significant activity over the past month.

Traders should pay attention to key levels and indicators for potential trading opportunities.

Candlestick Analysis

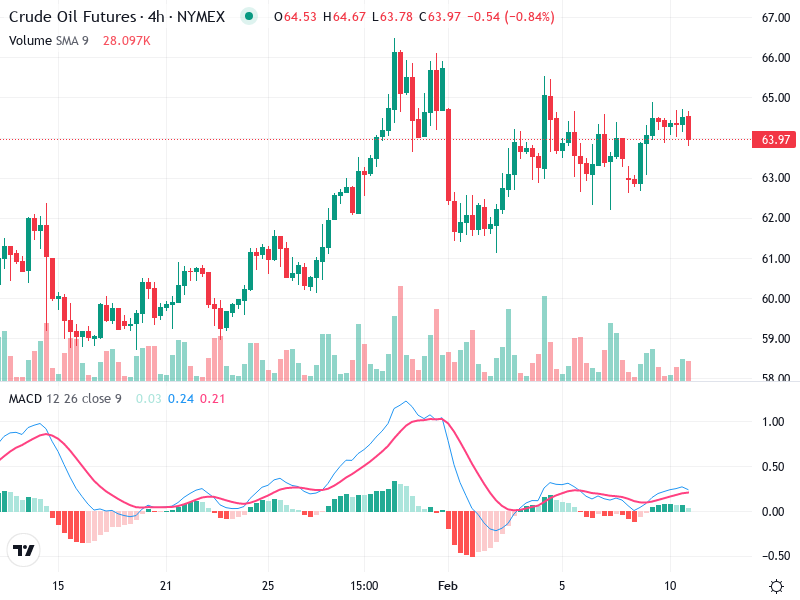
The chart shows an overall bullish trend from mid-January to the end of January, followed by a sideways consolidation pattern in February.

A Bullish Engulfing pattern was observed at the end of January, indicating a potential upward trend continuation.

Currently trading near $64, a previous breakout zone, which now acts as support.

MACD Analysis

The MACD line (blue) is near the Signal line (red), suggesting indecision with slight bullish momentum.

The histogram is slightly positive, indicating weak momentum favoring the bulls.

There are no clear divergences observed between the MACD and price action, supporting the current consolidation phase.

Volume Analysis

Volume increased significantly during the late January price surge, supporting the breakout.

Current volume is moderating, aligning with the consolidation pattern, lacking any significant spikes suggesting a reversal or breakout.

No clear indication of institutional activity due to moderate volume levels.

Support & Resistance

Support levels are around $63, a previous pullback level and psychological support.

Resistance levels are around $65, where the price has struggled to break decisively.

These levels are crucial for determining the next directional move—watch for breakouts or breakdowns at these levels.

Actionable Insights

Consider buying on a confirmed breakout above $65 with increasing volume.

Consider selling if the price breaks below $63 with supporting volume, indicating a potential bearish shift.

Holding may be advisable if the price remains within the current consolidation zone.

The AI Technical Analysis Center is an informational tool only and does not constitute investment or trading advice.
This site is registered on wpml.org as a development site. Switch to a production site key to remove this banner.