Generic selectors
Exact matches only
Search in title
Search in content
Post Type Selectors

Popular stocks

Crypto

CFD

Currencies

Support

Gold

OIL – Technical Analysis – 4h

February 12, 2026 17:00

Quick Summary

The chart indicates a noticeable shift in trend dynamics. Recent bearish patterns suggest a possible continuation of downward momentum. The asset has been fluctuating around key support and resistance levels, impacting potential future price actions.

Candlestick Analysis

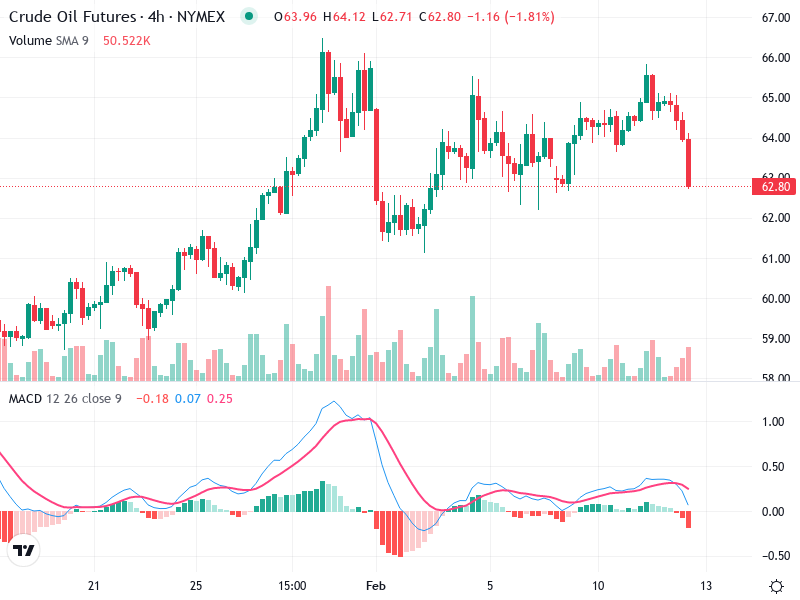
Recently, there was a bearish engulfing pattern, indicated by a large red candle following a smaller green one, suggesting a potential reversal from the recent highs.

The trend has shifted from bullish to sideways and is now showing signs of bearish momentum.

Immediate breakout point is around $62. Below this, there could be a significant drop if support doesn’t hold.

MACD Analysis

The MACD line has crossed below the Signal line, indicating a bearish crossover.

The histogram is below the zero line and widening, suggesting increasing bearish momentum.

No significant divergence is observed between MACD and price action currently.

Volume Analysis

Recent volume spikes coincide with bearish candlesticks, suggesting that the selling pressure is supported by increased volume.

Unusual spikes in volume around the recent price drop could indicate institutional selling.

Volume patterns are aligning with the overall bearish sentiment observed in the candlestick and MACD analyses.

Support & Resistance

Strong support is around $62. A break below this could indicate further downside.

Resistance is established around $65, where the price previously struggled to move higher.

Monitoring these levels is crucial for anticipating potential breakouts or reversals.

Actionable Insights

Given the bearish indications, a cautious approach is recommended. Consider selling if the price falls below $62 with confirmation.

Look for confirmation of a sustained move below $62 or a potential reversal signal to consider any buy opportunities.

Stay alert to shifts in volume and sentiment as external factors influence further market movements.

The AI Technical Analysis Center is an informational tool only and does not constitute investment or trading advice.
This site is registered on wpml.org as a development site. Switch to a production site key to remove this banner.