Generic selectors
Exact matches only
Search in title
Search in content
Post Type Selectors

Popular stocks

Crypto

CFD

Currencies

Support

Gold

OIL – Technical Analysis – 4h

September 5, 2025 07:09

Quick Summary

The chart portrays a persistent bearish trend following a recent peak around 66. A series of red candlesticks signal this decline, with prices stabilizing around a resistance zone.

MACD and volume analyses reinforce this bearish sentiment, albeit with moderate volume levels, suggesting cautious trading.

Candlestick Analysis

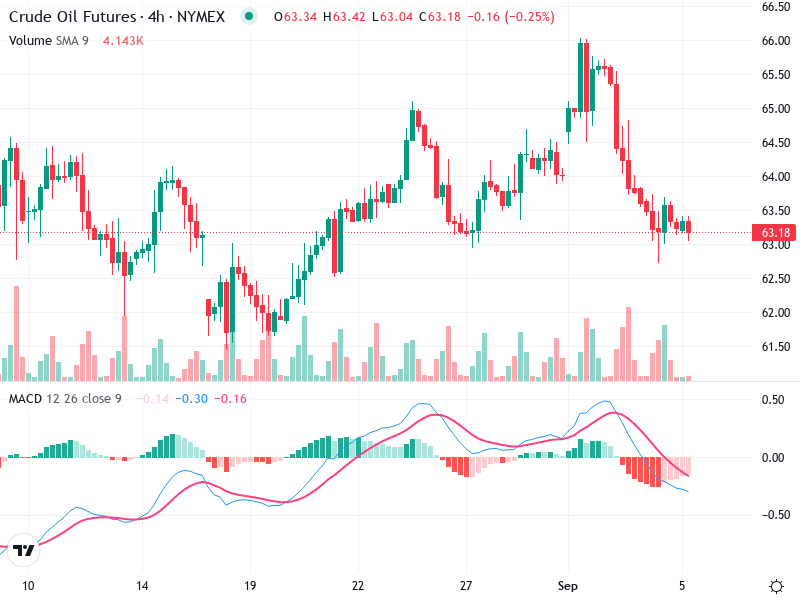
Recently, no clear bullish or bearish reversal patterns like engulfing or hammers are evident. The chart shows a series of red candlesticks indicating bearish momentum.

The current movement shows a bearish trend, with lower highs and lower lows after a recent peak around 66.

The price previously peaked around 66, which acted as a resistance before pulling back to the 63 zone, which may act as a temporary support.

MACD Analysis

The MACD line is below the Signal line, indicating bearish momentum. The lines are diverging, reinforcing the current downtrend.

The MACD histogram is in the negative territory and increasing in size, suggesting growing bearish momentum.

No significant MACD divergences with the price are visible at the moment.

Volume Analysis

Volume has been relatively stable, with no significant spikes that could indicate major institutional buying or selling.

The decrease in price has not been accompanied by a significant increase in volume, which might indicate a lack of strong selling conviction.

No unusual volume spikes that might suggest impending volatility are present.

Support & Resistance

The current support zone is around 63, where the price is hovering.

Above, the key resistance is near the recent high at 66 and potentially around 65, where previous consolidation occurred.

No unusual volume spikes that might suggest impending volatility are present.

Actionable Insights

Consider buying if the price stabilizes and forms a bullish reversal pattern at the support level around 63, coupled with a decrease in bearish momentum on the MACD.

Continue selling if the price breaks below 63 with increasing volume and further bearish MACD signals.

Holding might be prudent if the price moves sideways, without clear signals or decisive breaks.

The AI Technical Analysis Center is an informational tool only and does not constitute investment or trading advice.
This site is registered on wpml.org as a development site. Switch to a production site key to remove this banner.