Generic selectors
Exact matches only
Search in title
Search in content
Post Type Selectors

Popular stocks

Crypto

CFD

Currencies

Support

Gold

OIL – Technical Analysis – 4h

February 17, 2026 17:01

Quick Summary

The Crude Oil Futures chart displays a market in a transitional phase, balancing between a potential bullish reversal and continued bearish tendencies.

The analysis reveals critical levels where traders should monitor volume and momentum indicators for further direction.

Candlestick Analysis

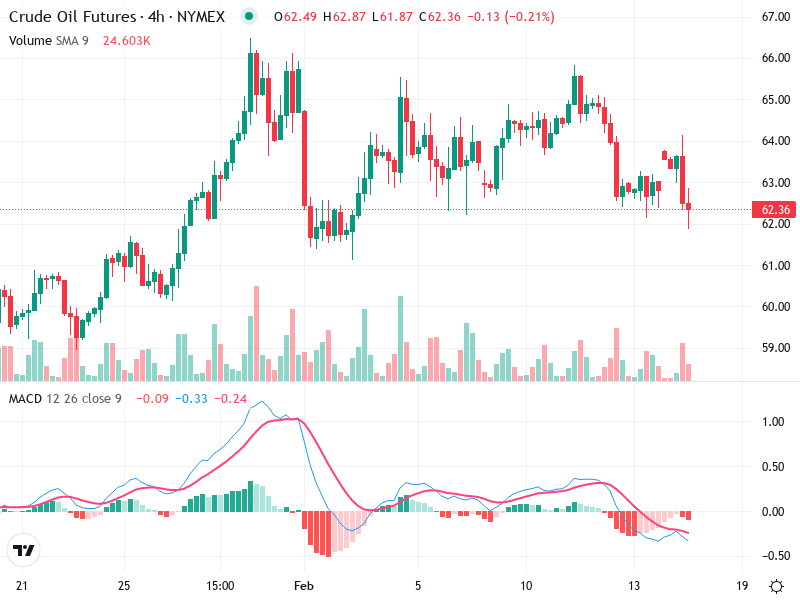
Several prominent candlestick patterns are identified, including the Bullish Engulfing seen during the uptrend in late January, hinting at a bullish reversal.

Recent doji patterns suggest indecision around the $62-$63 price levels, impacting directional certainty.

The overall trend is sideways, with failed breakout attempts above $65 reflecting weak momentum.

MACD Analysis

The MACD line is positioned below the Signal line, indicating prevailing bearish momentum, yet hints of recovery appear.

The histogram shows negative values but shrinking, suggesting a potential weakening of the bearish trend.

No clear divergence between MACD and price confirms the existing trend's persistence.

Volume Analysis

Recent declines happen with moderate volume, indicating a lack of commitment from sellers during downturns.

The decline in volume as prices drop may suggest the possibility of a downtrend exhaustion or reversal.

Significant volume spikes during the initial uptrend in late January hint at institutional involvement.

Support & Resistance

The $62 level serves as a significant support, with multiple rebounds observed at this point.

Resistance is faced at $65; breaking above this level could signal bullish strength.

Traders should keep an eye on movement around these critical support and resistance zones for potential shifts in trend.

Actionable Insights

Consider buying near the $62 support if bullish signals like a bullish engulfing pattern appear with increasing volume.

Short positions are viable if the $62 support is broken decisively, with strong confirming volume.

Monitor for a MACD bullish crossover as a bullish sentiment indicator; conversely, a break below $62 without support confirmation may enhance bearish pressure.

The AI Technical Analysis Center is an informational tool only and does not constitute investment or trading advice.
This site is registered on wpml.org as a development site. Switch to a production site key to remove this banner.