Generic selectors
Exact matches only
Search in title
Search in content
Post Type Selectors

Popular stocks

Crypto

CFD

Currencies

Support

Gold

OIL – Technical Analysis – 4h

March 3, 2026 17:00

Quick Summary

The asset’s chart reveals a strong bullish trend with recent aggressive price movements, suggesting a positive outlook.

Technical indicators highlight key resistance and support levels, crucial for potential trading decisions.

Candlestick Analysis

The chart shows a notable bullish trend with a recent aggressive upward movement.

Near the current price area, there's a potential bullish pattern developing with strong upward candles. There's also a long wick at the peak which may signal selling pressure or uncertainty.

The recent price broke out from a consolidation zone around $72, indicating strong upward momentum.

MACD Analysis

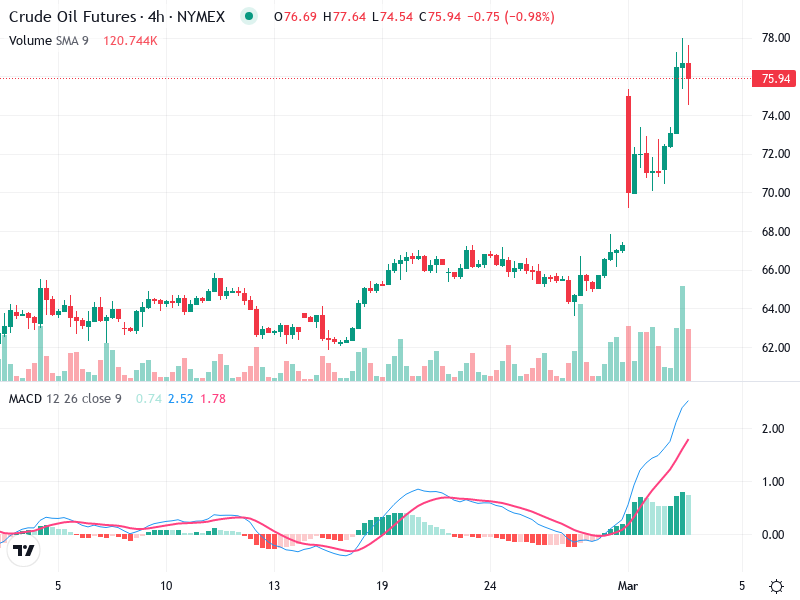
The MACD line is above the Signal line, confirming a bullish crossover previously, which is a positive sign.

The MACD histogram is positive and expanding, suggesting increasing bullish momentum.

No divergence is present, as price and MACD both reflect bullish momentum.

Volume Analysis

There's a noteworthy increase in volume aligning with the recent price breakout, supporting the upward price movement.

Significant volume spikes suggest potential institutional participation, validating the strong breakout.

Volume trends are indicative of sustained interest in the asset, aligning with the bullish outlook.

Support & Resistance

Around $72 serves as a new support, previously a resistance before the breakout.

Immediate resistance is around $77 based on recent price rejection and long wick candlesticks.

Monitoring these levels is crucial for understanding future price movements.

Actionable Insights

Considering the bullish momentum, a buy strategy on pullbacks towards $72 support could be considered. Monitor for confirmation of support holding.

Watch for any bearish patterns or MACD crossovers that could signal reversals. The long upper wick near $77 indicates possible selling pressure.

Remain vigilant for changes in market conditions that could impact the current trend.

The AI Technical Analysis Center is an informational tool only and does not constitute investment or trading advice.
This site is registered on wpml.org as a development site. Switch to a production site key to remove this banner.