Generic selectors
Exact matches only
Search in title
Search in content
Post Type Selectors

Popular stocks

Crypto

CFD

Currencies

Support

Gold

OIL – Technical Analysis – 4h

March 5, 2026 17:01

Quick Summary

The asset chart reflects a strong upward trend with consistent buying pressure.

A breakout movement suggests continued bullish momentum.

Volume changes and trend shifts are essential for analysis.

Candlestick Analysis

The chart reveals a strong bullish trend reinforced by an upward move.

Small-bodied candles indicate momentary consolidation amidst buying pressure.

A breakout above the previous resistance around 77.5 confirms bullish momentum.

MACD Analysis

The MACD line crossing above the Signal line indicates a positive bullish crossover.

The MACD histogram shows positive momentum, with slight tapering suggesting cautious optimism.

No diverging signals between MACD and price action reinforce the bullish trend.

Volume Analysis

Significant volume increase during price movement supports the bullish breakout.

Both volume and price increase suggest strong buying strength.

Volume spikes may indicate potential institutional buying.

Support & Resistance

Support is around the breakout level of 77.5, with a drop potential for pullbacks.

Resistance is psychological and technical at around 80, crucial for further breakout.

Caution is advised at resistance levels for potential responses to volume changes.

Actionable Insights

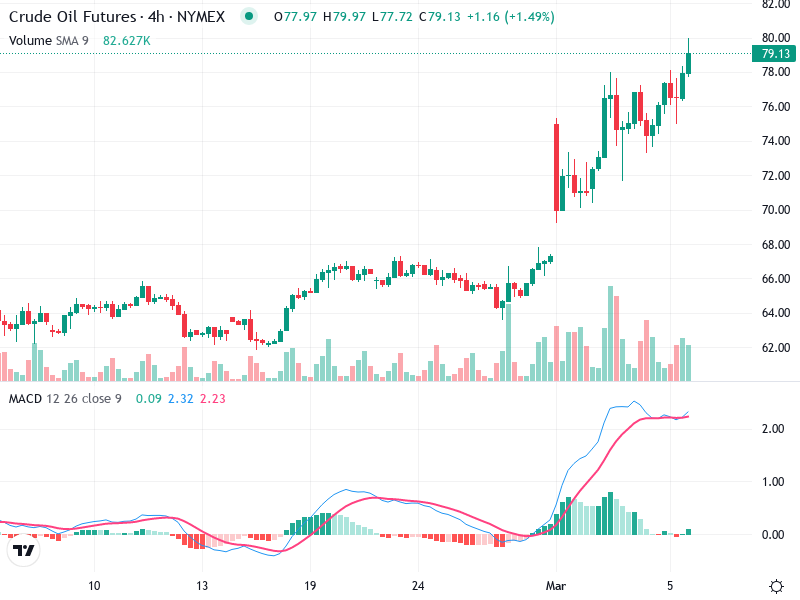
Consider a buy strategy on pullbacks near the support level of 77.5, managing risk with stop loss.

Monitor resistance around 80 for potential pullbacks if not supported by strong volume.

If already invested, maintaining a position while monitoring volume and price action near resistance is advisable.

The AI Technical Analysis Center is an informational tool only and does not constitute investment or trading advice.
This site is registered on wpml.org as a development site. Switch to a production site key to remove this banner.