Generic selectors
Exact matches only
Search in title
Search in content
Post Type Selectors

Popular stocks

Crypto

CFD

Currencies

Support

Gold

OIL – Technical Analysis – 4h

March 6, 2026 17:00

Quick Summary

The Crude Oil Futures chart shows a robust bullish momentum characterized by higher highs and higher lows.

Recent bullish candlesticks and increased volume suggest strong upward momentum.

External factors such as geopolitical events could also impact the trend.

Candlestick Analysis

The overall trend is strongly bullish, evidenced by a series of higher highs and higher lows.

Recently, there is a continued series of bullish candlesticks indicating sustained upward momentum. No significant reversal patterns like doji or bearish engulfing are visible currently.

The price appears to have broken out past the resistance around $76 convincingly, with strong bullish candles suggesting a continuation of the upward trend.

MACD Analysis

The MACD line is well above the Signal line, indicating a bullish crossover that took place a while back, continuing to support the upward momentum.

The increasing length of the MACD histogram bars suggests strengthening bullish momentum.

No bearish divergence is apparent as both price and MACD are making higher highs.

Volume Analysis

There is a significant increase in volume associated with the recent price surge, supporting the upward price movement.

The notable spikes in volume may suggest strong institutional buying or increased trader activity, reinforcing the current trend.

Increased volume generally supports sustained price moves, indicating persistent strength in the market.

Support & Resistance

The previous resistance at around $76 may now act as new support.

The chart doesn’t show imminent resistance at current levels, but as prices approach historical highs, keep an eye on previous peaks for potential resistance levels.

Continuing to monitor these levels is crucial for identifying potential reversal points.

Actionable Insights

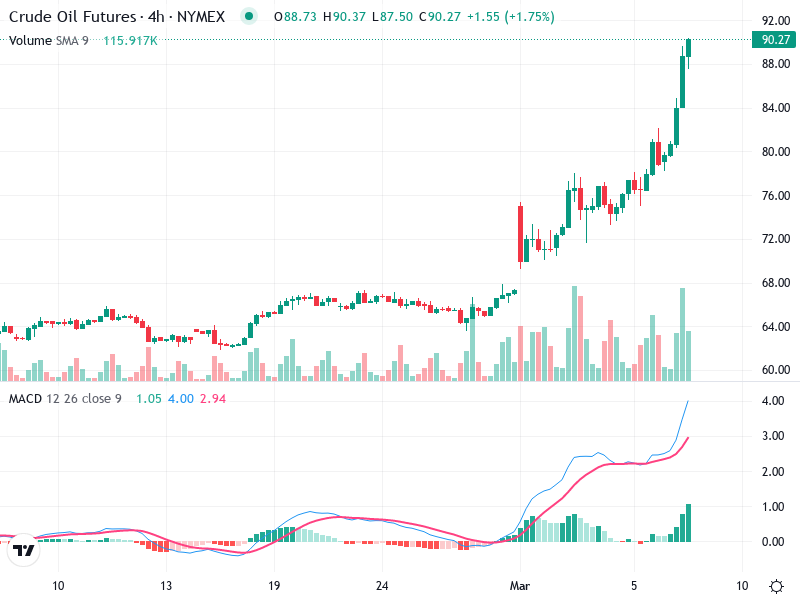
Consider buying on pullbacks towards the support level around $76, provided bullish signals confirm the resumption of the trend.

In the absence of bearish reversal signals, holding long positions might be favorable. However, be vigilant for potential exhaustion signals.

Continuation of high volume with price increases indicates sustained strength. Watch for any bearish candlestick formations or MACD crossovers for potential exit signals.

The AI Technical Analysis Center is an informational tool only and does not constitute investment or trading advice.
This site is registered on wpml.org as a development site. Switch to a production site key to remove this banner.