Generic selectors
Exact matches only
Search in title
Search in content
Post Type Selectors

Popular stocks

Crypto

CFD

Currencies

Support

Gold

OIL – Technical Analysis – 4h

March 9, 2026 17:01

Quick Summary

The Crude Oil Futures chart reveals a fascinating market scenario. Recent trends suggest significant movements, requiring careful observation. Understanding these fluctuations is key for strategic trading.

Candlestick Analysis

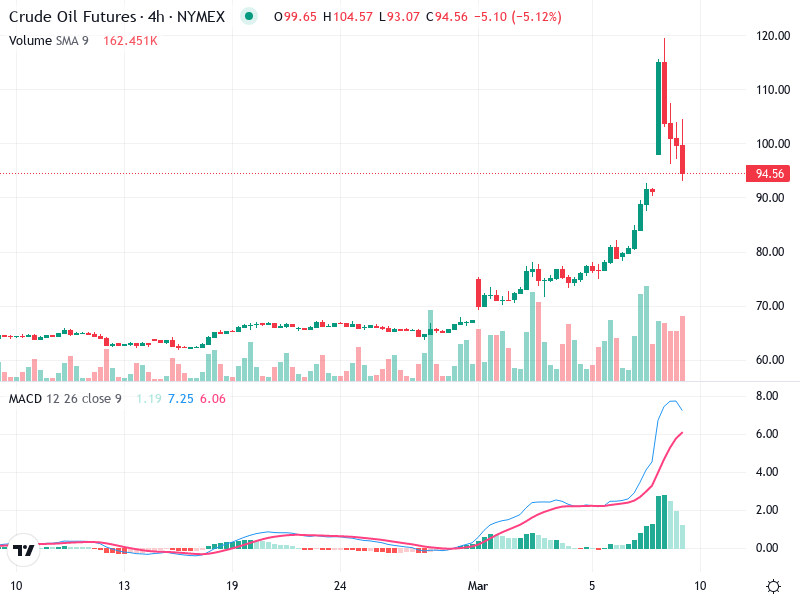
The chart shows a strong bullish trend that has recently faced a significant pullback.

Prior to the latest decline, there is a large red candle indicating a potential bearish reversal pattern after a strong uptrend, resembling a bearish engulfing or long-legged doji. This suggests strong selling pressure.

The price attempted to break above the $104.57 level but failed, indicating a potential resistance zone. The strong downward move suggests a pullback after hitting this resistance.

MACD Analysis

The MACD line (blue) has dramatically increased during the uptrend but is now turning down, indicating a loss of bullish momentum. The Signal line (red) is also starting to flatten and may cross the MACD line if the bearish movement continues.

The declining histogram aligns with the recent price drop, suggesting weakening upward momentum and increasing bearish sentiment.

No significant divergence is currently evident, as both price and MACD movement align.

Volume Analysis

A substantial increase in volume accompanied the recent price peak and subsequent decline, which suggests that the drop is supported by significant selling pressure.

Volume spikes during the upward move and near the recent peak indicate potential institutional activity or heightened trader interest, aligning with the resistance level breakout attempt.

Support & Resistance

The $104.57 mark is a notable resistance level, evidenced by the sharp decline once this area was tested.

Around the $90 level appears to be a psychological and short-term support level, as the price briefly consolidated around this region before the recent rise.

Actionable Insights

Caution is advised in the short term. A sell/exit strategy might be warranted for those already in positions, particularly if the downward momentum continues past immediate support at $90.

Traders should watch for confirmation signals, such as a bullish candlestick pattern at the support level or a new upward movement in MACD.

Significant downside risk if support at $90 fails, leading to potential further declines.

The AI Technical Analysis Center is an informational tool only and does not constitute investment or trading advice.
This site is registered on wpml.org as a development site. Switch to a production site key to remove this banner.