Generic selectors
Exact matches only
Search in title
Search in content
Post Type Selectors

Popular stocks

Crypto

CFD

Currencies

Support

Gold

OIL – Technical Analysis – 4h

March 10, 2026 17:00

Quick Summary

The technical analysis of Crude Oil Futures reveals a predominantly bearish sentiment in the market. The chart highlights a recent peak followed by a significant downturn. Various indicators suggest ongoing bearish momentum, but key support levels might attract buyers.

Investors should be cautious of the current trend and potential market volatility.

Candlestick Analysis

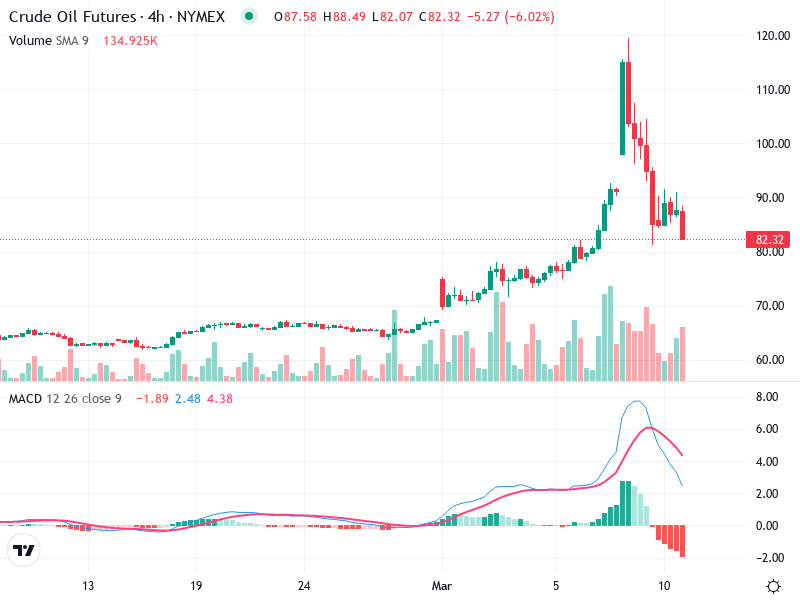
Recently observed is a bullish rally that peaked, followed by a strong bearish pattern. Notably, the last few candlesticks resemble a bearish engulfing pattern, indicating potential continuation of bearish sentiment.

The candlestick size suggests strong selling pressure.

The trend is currently bearish, following a sharp increase to a peak above $120, followed by a steep decline.

MACD Analysis

A bearish crossover has recently occurred where the MACD line has crossed below the Signal line, indicating a shift towards bearish momentum.

The histogram is showing increasing negative values, suggesting growing bearish momentum.

No significant divergences observed between the MACD and price action, aligning with the downward trend.

Volume Analysis

There was a substantial increase in volume during the upward rally, followed by a continued high volume during the sell-off, indicating strong participation in the recent moves.

The spike in volume along with the price drop suggests potential institutional selling or profit-taking at the recent high levels.

The persistent high volume underscores the strong market interest in recent price movements.

Support & Resistance

A breakout above $100 led to a quick reversal from its peak down to the current region near $82.32, which serves as a pullback.

Key resistance is around $100-120, where the price previously peaked and reversed.

Current support is observed around $80, which may hold if buyers step in.

Actionable Insights

Consider selling or shorting at price rallies unless the trend shows signs of reversal. Watch for confirmation signals such as a bullish reversal pattern.

For existing short positions, holding may be beneficial until a reversal signal is evident.

Watch for a potential reversal signal near the $80 support. Confirmation through reduced selling volume or a bullish pattern is needed for a trend change.

The AI Technical Analysis Center is an informational tool only and does not constitute investment or trading advice.
This site is registered on wpml.org as a development site. Switch to a production site key to remove this banner.