Generic selectors
Exact matches only
Search in title
Search in content
Post Type Selectors

Popular stocks

Crypto

CFD

Currencies

Support

Gold

OIL – Technical Analysis – 4h

March 11, 2026 17:00

Quick Summary

The Crude Oil Futures chart reveals significant market activity and potential turning points. The asset’s recent movements suggest a cautious sentiment, with notable consolidation phases following bullish rallies. Understanding these dynamics is crucial for making informed trading decisions.

Candlestick Analysis

The chart shows a large bullish candlestick followed by several smaller candles, indicating profit-taking and potential indecision in the market.

The presence of both red and green candlesticks suggests a series of consolidation patterns.

There's a significant resistance around the $90-$92 range marked by previous highs, with support near $82.

MACD Analysis

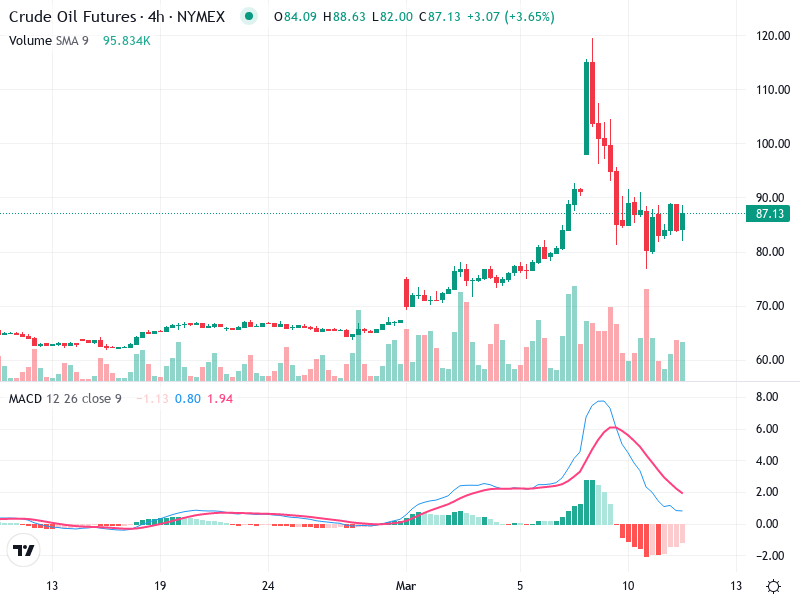
The MACD line is below the Signal line, indicating a recent bearish crossover. However, the lines are converging, suggesting potential weakening of bearish momentum.

The MACD histogram shows diminishing red bars, indicating that the downward momentum is losing strength.

There is no clear divergence between MACD and price action, with current moves consistent with MACD readings.

Volume Analysis

There was a significant spike in volume correlating with the strong bullish move. Current volumes are slightly below the previous highs, aligning with the consolidation phase.

High volumes supported the bullish breakout, while the decrease during consolidation suggests a lack of strong selling pressure.

The large volumes accompanying bullish moves may indicate possible institutional buying.

Support & Resistance

Key support is around $82, where the market found previous support during pullbacks.

Key resistance is near $90-$92, a level from which it struggled to break recently.

Actionable Insights

Consider buying if there is a confirmed breakout above the $92 resistance with high volume.

Selling might be considered if there is a breakdown below the $82 support on higher volume.

Holding is advisable if the price remains within the current consolidation range until a clear signal of either breakout or breakdown is provided.

The AI Technical Analysis Center is an informational tool only and does not constitute investment or trading advice.
This site is registered on wpml.org as a development site. Switch to a production site key to remove this banner.