Generic selectors
Exact matches only
Search in title
Search in content
Post Type Selectors

Popular stocks

Crypto

CFD

Currencies

Support

Gold

OIL – Technical Analysis – 4h

March 12, 2026 17:00

Quick Summary

The Crude Oil Futures chart displays notable volatility, with an initial upward trend followed by a sharp pullback and recovery.

The asset demonstrates the potential for further bullish movement if key resistance levels are surpassed, supported by increasing volume during price advances.

Candlestick Analysis

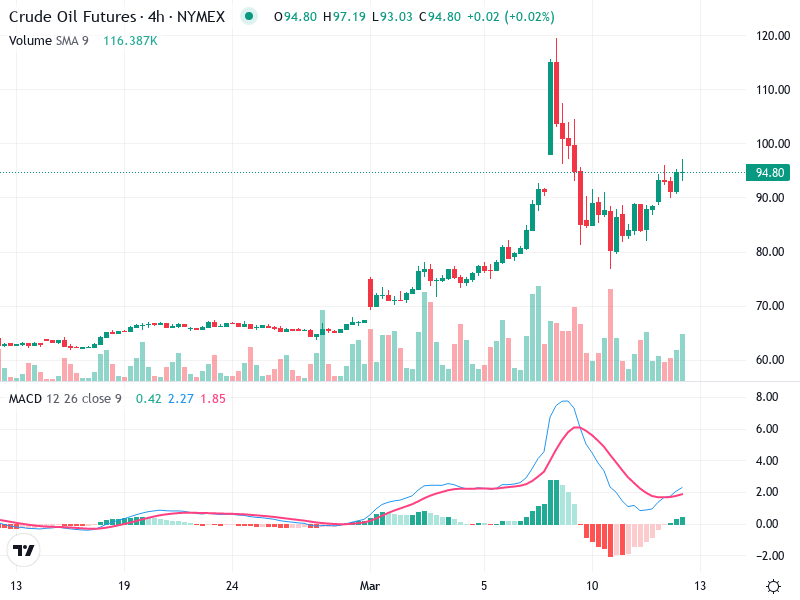
The chart shows an initial uptrend followed by a sharp pullback and then a recovery phase, suggesting volatility.

Around the pullback, there appears to be a hammer pattern, which typically indicates a potential reversal or end to a downtrend.

There is a breakout above the $90 level, indicating a strong bullish move, with the potential for a further push upwards.

MACD Analysis

The MACD line is below the signal line but is turning upwards, which may signal a potential bullish crossover soon.

The histogram shows decreasing bearish momentum, suggesting a possible shift to bullish momentum.

No significant divergence observed between the MACD and the price, indicating that the recent price action is supported by the MACD movement.

Volume Analysis

There is an increase in volume during upward moves, supporting the price increases.

Significant volume spikes appeared during the initial run-up and subsequent pullback, hinting at potential institutional activity or strong market interest.

The volume trends align with the observed price movements, reinforcing potential bullish signals.

Support & Resistance

Support is around $90, which has been breached, indicating a strong support zone.

Resistance is near $100, where the price previously peaked, serving as a resistance zone that needs to be overcome for further bullish continuation.

These levels are crucial for determining future price action and potential breakout or breakdown scenarios.

Actionable Insights

Consider buying on a confirmed bullish crossover in the MACD or if the price convincingly breaks above $100 with strong volume.

If holding, watch for support at $90 and anticipate potential resistance challenges at $100 and above.

Enter sell positions if the price fails to maintain above $90 with increasing bearish volume.

The AI Technical Analysis Center is an informational tool only and does not constitute investment or trading advice.
This site is registered on wpml.org as a development site. Switch to a production site key to remove this banner.