Generic selectors
Exact matches only
Search in title
Search in content
Post Type Selectors

Popular stocks

Crypto

CFD

Currencies

Support

Gold

OIL – Technical Analysis – 4h

September 11, 2025 07:10

Quick Summary

The Crude Oil chart reveals a potentially shifting trend.

Despite a recent bearish trend, signs of bullish momentum are emerging.

Traders should note the key levels for confirming trend direction.

Candlestick Analysis

The chart shows a series of candlesticks indicating recent bullish momentum following a strong bearish trend.

There appears to be a potential reversal pattern, with the recent candles forming higher lows, consistent with a bullish reversal.

The current trend seems to be transitioning from bearish to potentially bullish, suggesting a sideways movement with a bullish bias.

MACD Analysis

The MACD line is above the Signal line, indicating a bullish crossover.

The histogram shows increasing bullish momentum as the bars become larger, supporting potential upwards momentum.

There doesn’t appear to be significant divergence between MACD and price action, suggesting the momentum aligns well with the recent price increase.

Volume Analysis

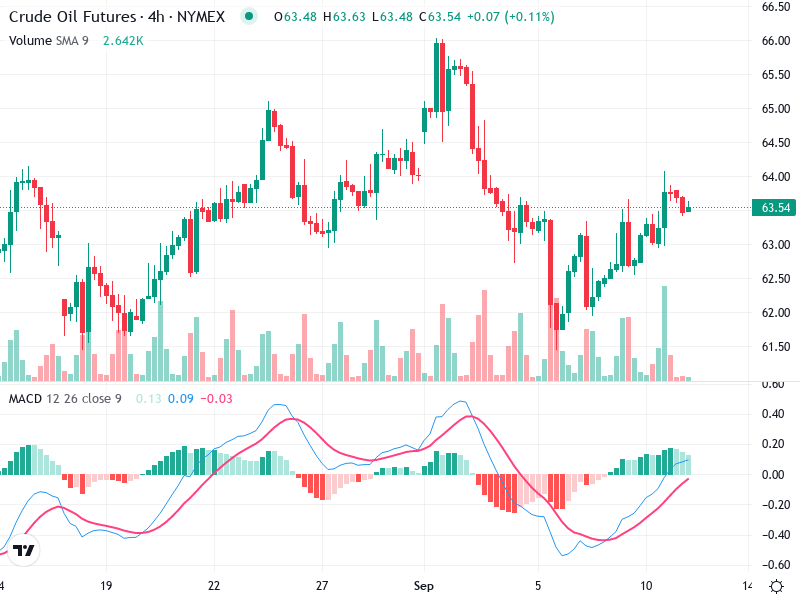
Volume spikes are noticeable during recent up movements, suggesting buying interest, possibly institutional.

The volume trend supports the recent upward price movement, confirming the bullish sentiment.

No unusual volume spikes contradict the upward trend, strengthening the interpretation of an ongoing reversal.

Support & Resistance

Key support is identified around $62.00, where several candlesticks have previously found buying pressure.

The resistance level at around $64.50 could pose a challenge in the near term; a breakout here would confirm further bullish momentum.

These levels are crucial for traders to watch for potential reversals or breakout confirmations.

Actionable Insights

**Buy Strategy**: Consider entering a long position if the price breaks above $64.50 with strong volume support.

**Sell Strategy**: If the price fails to hold above $62.00, there could be a reversion to the bearish trend.

**Hold Strategy**: Monitor price action near the current levels to confirm trend stability before committing to new positions.

The AI Technical Analysis Center is an informational tool only and does not constitute investment or trading advice.
This site is registered on wpml.org as a development site. Switch to a production site key to remove this banner.