Generic selectors
Exact matches only
Search in title
Search in content
Post Type Selectors

Popular stocks

Crypto

CFD

Currencies

Support

Gold

OIL – Technical Analysis – 4h

September 17, 2025 07:12

Quick Summary

The chart reflects an interesting phase.

It shows potential for a breakout as it approaches key resistance levels.

Traders should be vigilant as the price action suggests a potential shift in momentum.

Candlestick Analysis

The chart shows a generally sideways movement with some bullish attempts.

The recent candlestick formation indicates a possible resistance near $65 as the price retraces after a bullish move.

A consolidation zone is visible with small-bodied candles, suggesting indecision or a pause in momentum.

MACD Analysis

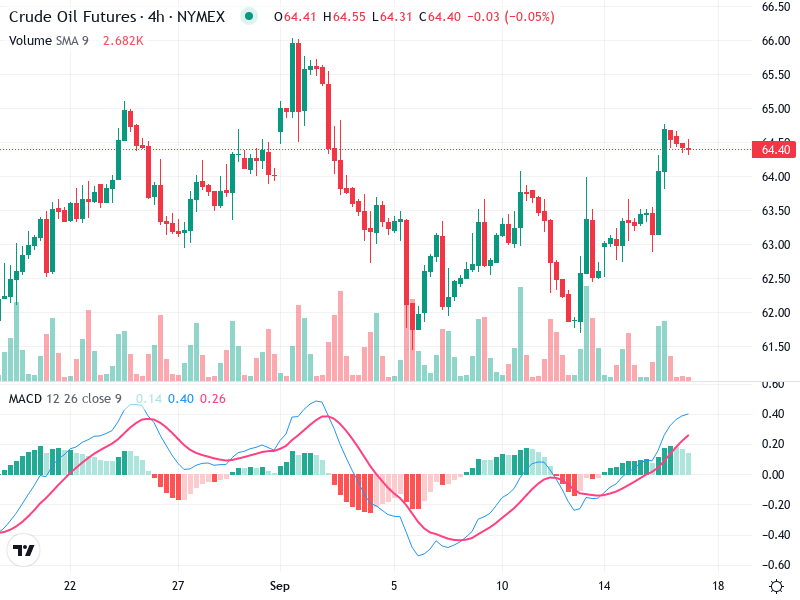
A bullish crossover is visible as the MACD line (blue) crosses above the Signal line (red), indicating potential upward momentum.

The MACD histogram shows increasing positive momentum, suggesting buying pressure could be building.

Currently, no significant divergence between MACD and price action is noted.

Volume Analysis

There has been moderate volume accompanying the recent upward price moves, which supports the bullish sentiment.

However, the volume has tapered off slightly, indicating a pause or consolidation.

No significant volume spikes that indicate unusual activity.

Support & Resistance

Around $63 is a recent level providing support.

At $65, as the price struggled to break and hold above this level.

Traders should monitor the $65 resistance closely.

Actionable Insights

Consider entry on a breakout above $65 with increased volume for confirmation.

Be cautious of sell signals if the price fails to hold support at $63.

A bearish crossover in MACD would reinforce this action.

The AI Technical Analysis Center is an informational tool only and does not constitute investment or trading advice.
This site is registered on wpml.org as a development site. Switch to a production site key to remove this banner.