Generic selectors
Exact matches only
Search in title
Search in content
Post Type Selectors

Popular stocks

Crypto

CFD

Currencies

Support

Gold

OIL – Technical Analysis – 4h

September 24, 2025 16:00

Quick Summary

The Crude Oil Futures chart shows bullish trends supported by significant technical indicators. Recent price movement has been predominantly upward, reflecting strong market sentiment. The asset has demonstrated potential for further upward movement, provided there are no major negative influences.

Candlestick Analysis

Recent price action shows a series of strong bullish candles, indicating buying pressure.

No clear reversal patterns like dojis or hammers are evident, supporting continued bullish momentum.

The price has broken out above the previous resistance around $64.20. This breakout could suggest further upside potential.

MACD Analysis

The MACD line is above the Signal line, indicating a bullish crossover, which is typically a bullish signal.

The histogram bars are increasing in height, suggesting strengthening bullish momentum.

There is no evident divergence between the MACD and price action, supporting the upward movement.

Volume Analysis

A noticeable increase in volume accompanies the latest bullish move, confirming the strength of the upward trend.

The increase in volume supports the price breakout above resistance, indicating genuine buying interest.

The marked volume spikes suggest possible institutional activity driving the recent price increase.

Support & Resistance

The previous resistance around $64.20 is now a potential support level.

Another support level can be identified at around $62.50.

The next significant resistance appears near $65.00, which may test the strength of the current uptrend.

Actionable Insights

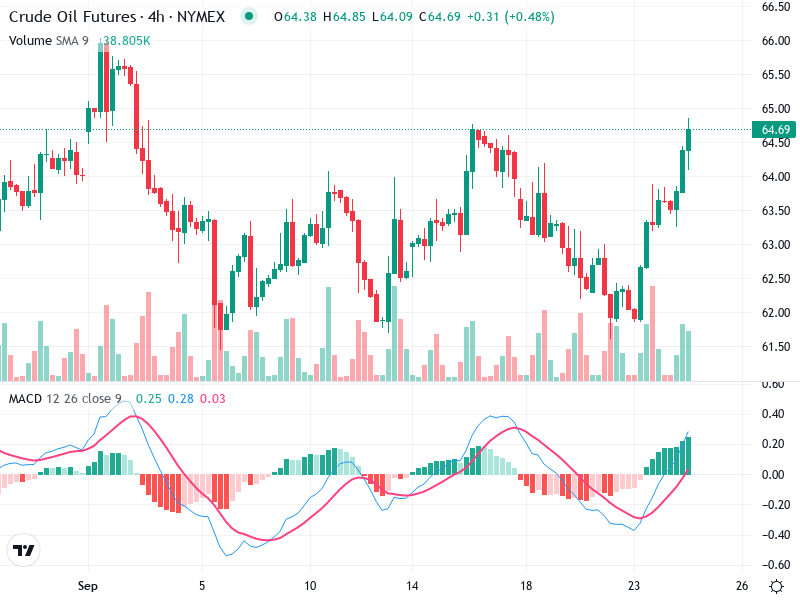
Consider buying on any pullback towards $64.20, using it as a support level, with a stop-loss below $63.90 to mitigate risk.

Look for signs of weakness or reversal at the $65.00 resistance level, which might be an area to take profits or short, if bearish signals appear.

Watch for confirmation of sustained volume above average to maintain confidence in the uptrend.

The AI Technical Analysis Center is an informational tool only and does not constitute investment or trading advice.
This site is registered on wpml.org as a development site. Switch to a production site key to remove this banner.